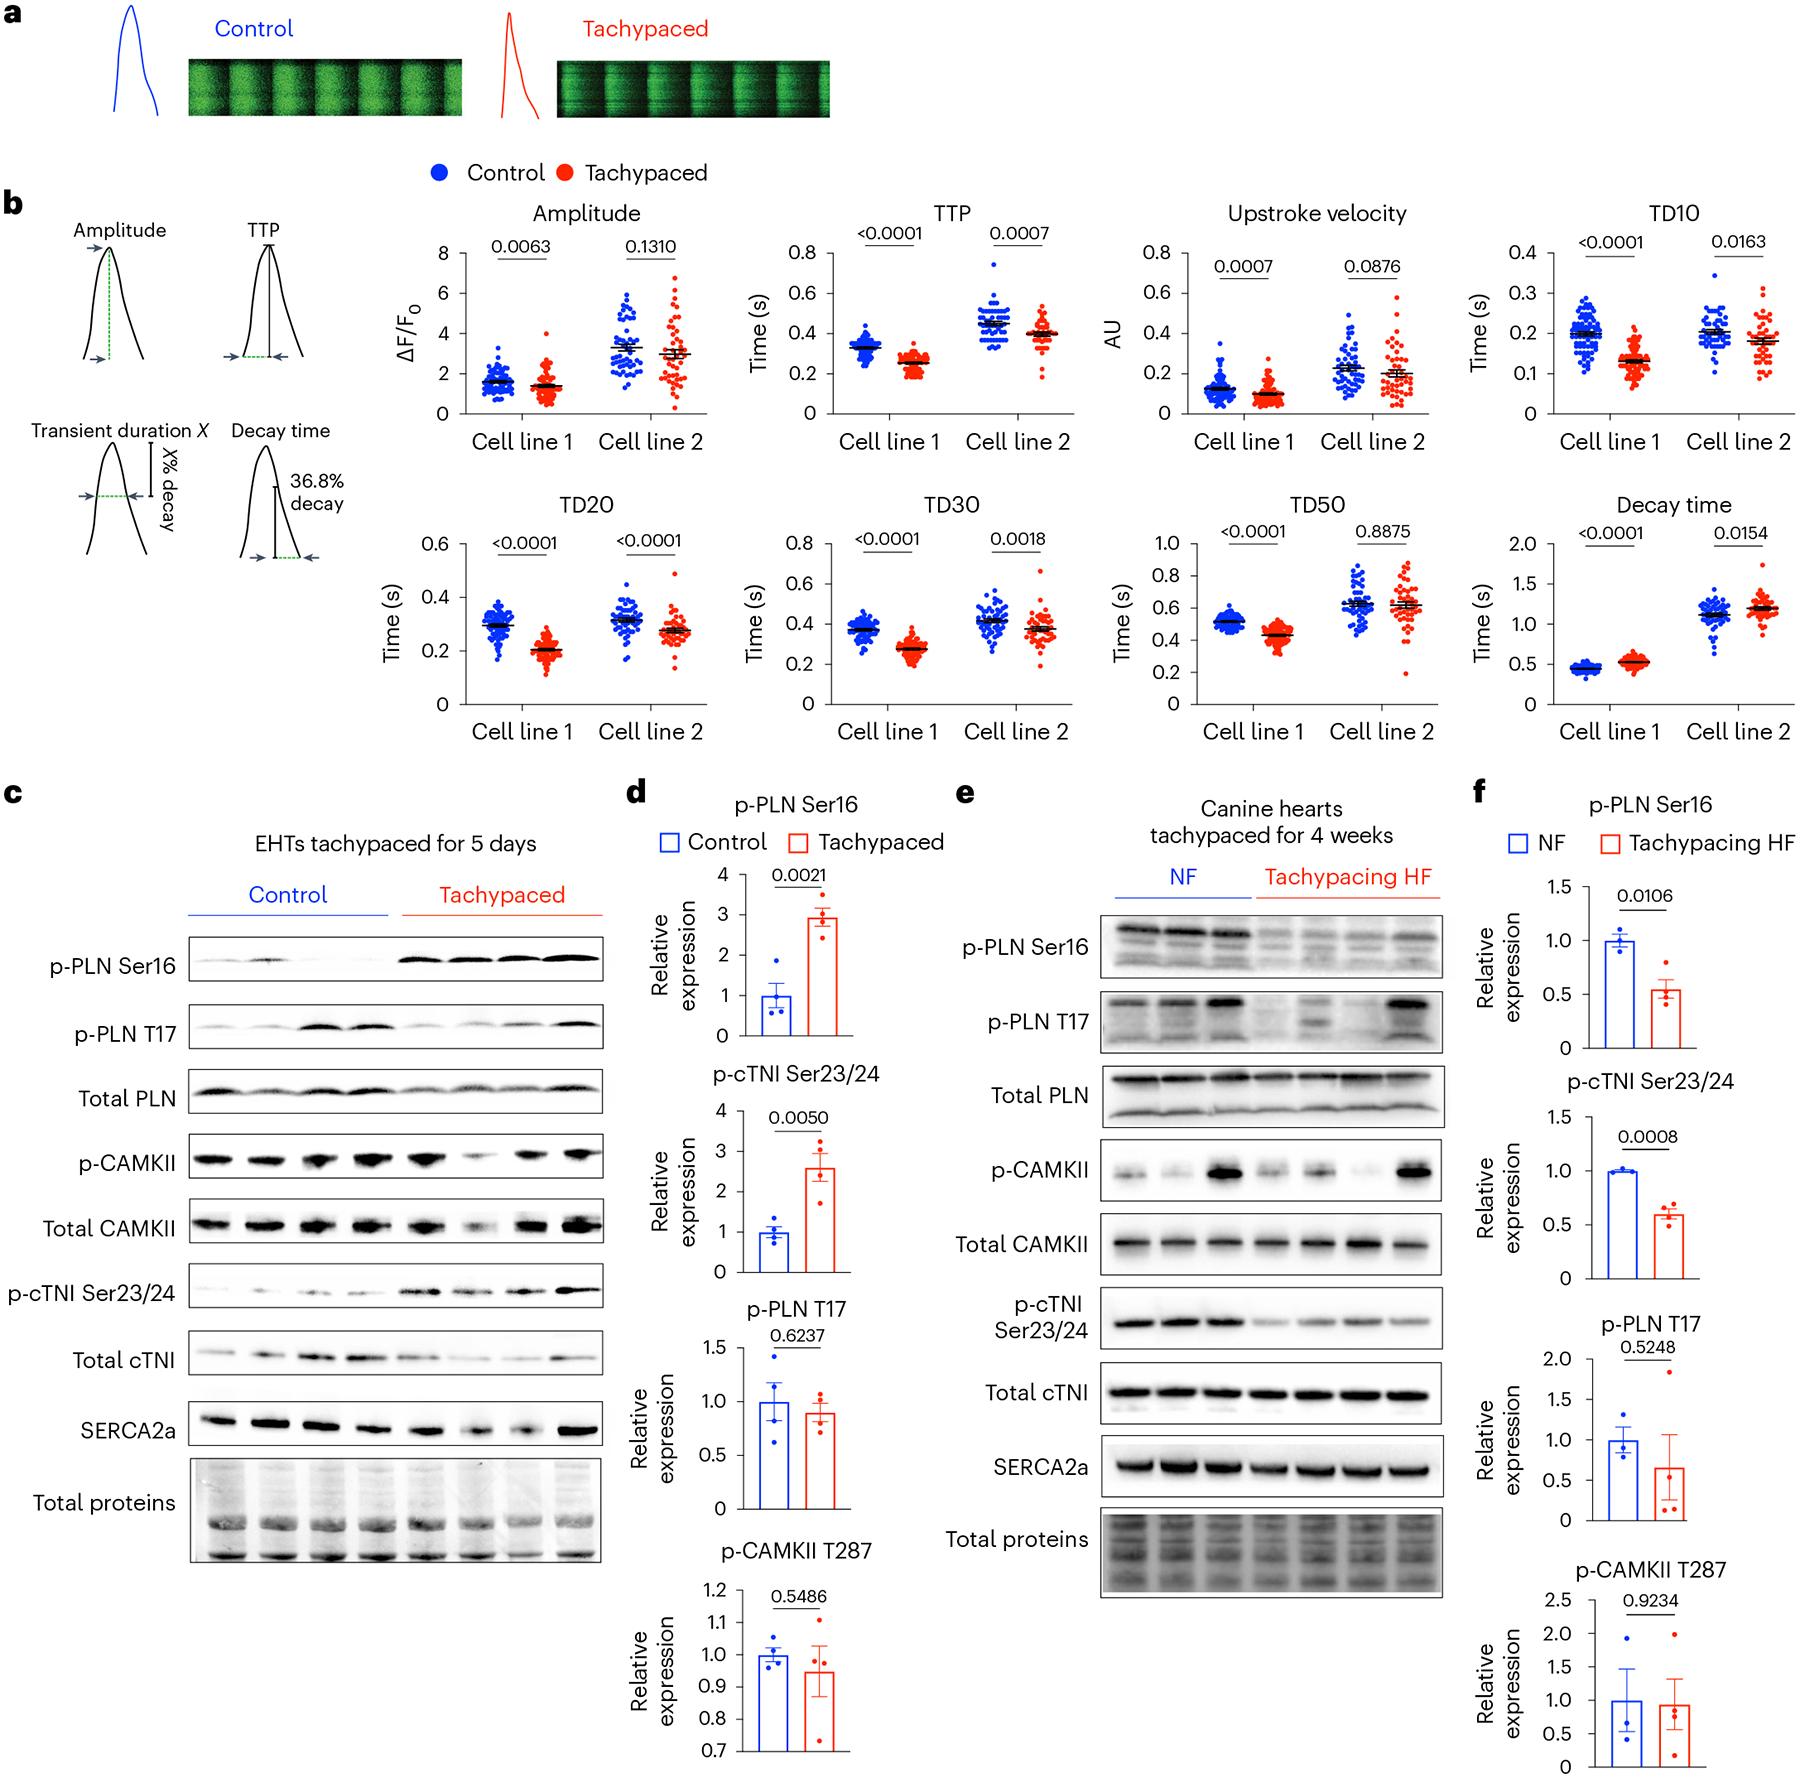
Fig. 5 |. PKA signalling is dysregulated by tachypacing in a biphasic manner.

a, Monolayers of iPSC–CMs were tachypaced at 3 Hz for 5 days and imaged with the Fluo-4 dye using confocal line-scanning microscopy. Cells were paced at 0.5 Hz or 1 Hz during imaging. Representative images of calcium transients from single tachypaced iPSC–CMs (indicated by red) or unpaced control (indicated by blue). This experiment was independently performed in two different iPSC lines. b, Parameters of calcium handling were quantified in control and tachypaced iPSC–CMs, including calcium amplitude, TTP, upstroke velocity, TD10, TD20, TD30, TD50 and decay time (36.8% decay to the end of the transient). For cell line 1 (SCVI-273), n = 75 cells for the control group and n = 86 cells for the tachypaced group; for cell line 2 (SCVI-15), n = 53 cells for the control group and n = 46 cells for the tachypaced group. Two-tailed Mann–Whitney test. Data are displayed as mean ± s.e.m. c, EHTs were tachypaced for 5 days at 3 Hz (SCVI-273), followed by protein extraction and western blot analysis of phosphorylated PLN at Ser16 (p-PLN Ser16), phosphorylated PLN at Thr17 (p-PLN T17), total PLN, phosphorylated CAMKII at T287 (p-CAMKII T287), total CAMKII, phosphorylated cardiac troponin I at Ser23/24 (p-cTNI Ser23/24), total cTNI and SERCA2a. d, Expression of p-PLN Ser16, p-PLN T17, p-cTNI Ser23/24 and p-CAMKII in EHTs. Data were normalized against the unpaced EHTs. n = 4 EHTs per group. e, Western blot analysis of p-PLN Ser16, p-PLN T17, total PLN, p-CAMKII, total CAMKII, p-cTNI Ser23/24, total cTNI and SERCA2a in dogs with non-failing hearts (NF) or with tachypacing-induced HF. f, Expression of p-PLN Ser16, p-PLN T17, p-cTNI Ser23/24 and p-CAMKII in the canine samples. Data were normalized against the NF group. n = 3 NF dogs and n = 4 HF dogs. For d and f, an unpaired Student’s t-test was applied. Data are displayed as mean ± s.e.m.
