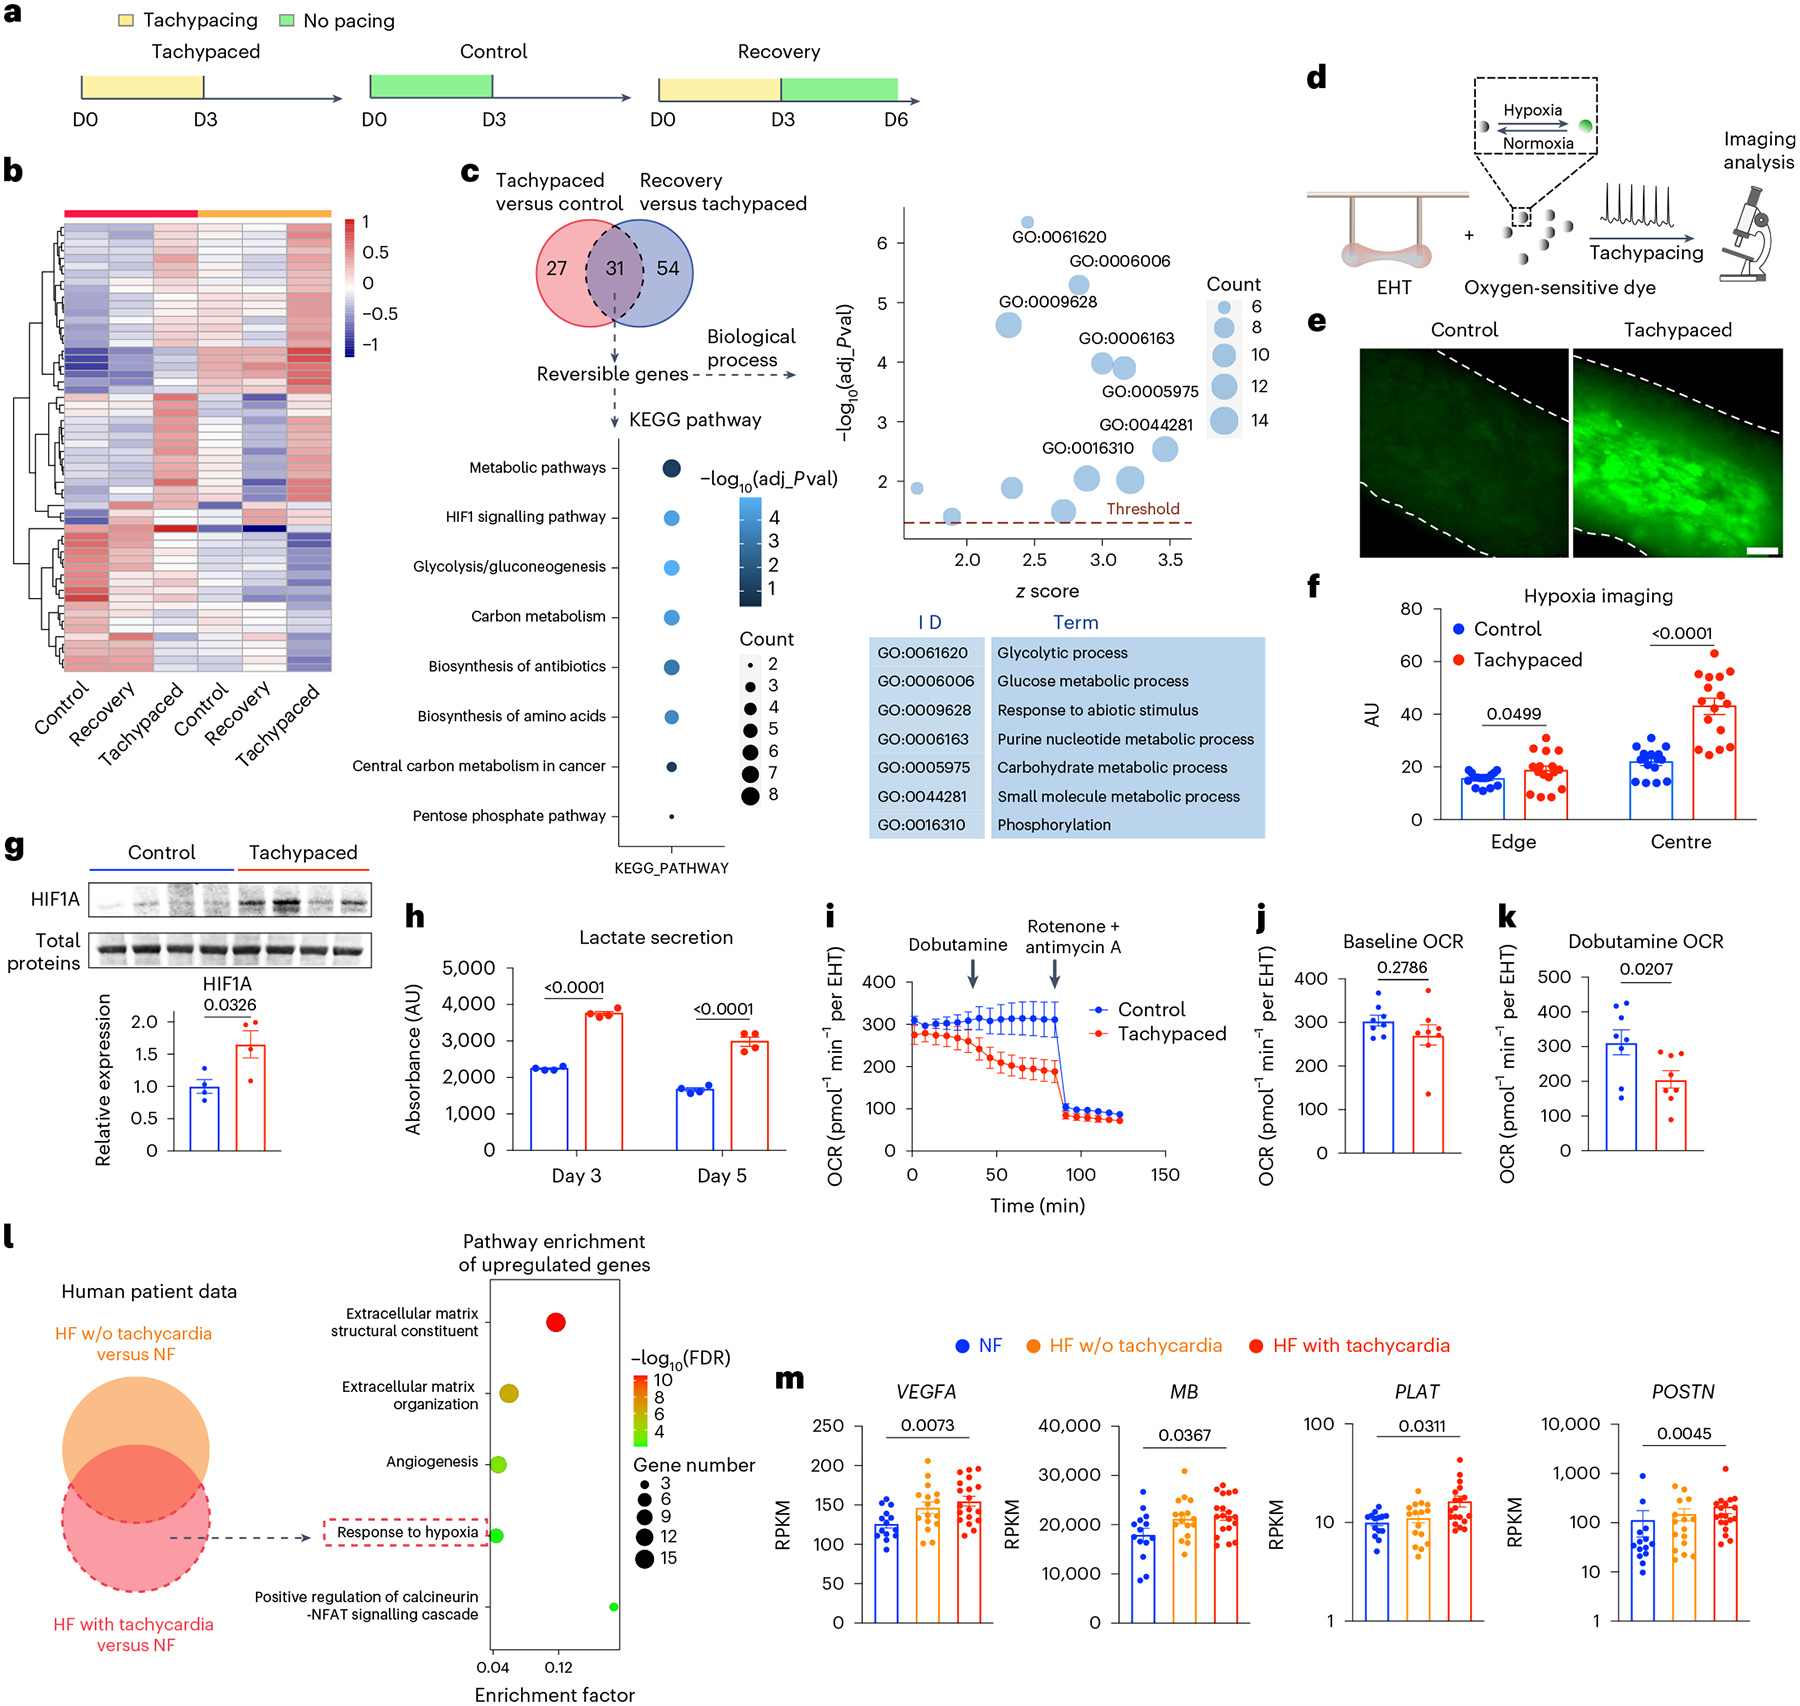
Fig. 6 |. Tachycardia promotes tissue hypoxia.

a, RNA-seq analysis of three groups of EHTs: tachypaced EHTs, unpaced EHTs and tachypaced EHTs after recovery. b, Heat map of DEGs between tachypaced and unpaced EHTs are shown in six samples from two independent batches (SCVI-273). c, Pathway analysis and GO analysis of genes reversibly affected by tachypacing. The cutoff of adjusted p-value (adj_pval) was 0.05. d, Schematic illustration of hypoxia imaging: EHTs (SCVI-273) were incubated with an oxygen-sensitive dye and then subjected to tachypacing at 3 Hz or no pacing for 3 h, followed by fluorescence imaging. e, Representative fluorescence images of unpaced control EHTs and tachypaced EHTs. Scale bar, 200 μm. f, Quantification of the fluorescence intensity from unpaced control EHTs (indicated by blue) and tachypaced EHTs (indicated by red) at the edge of the tissue or the centre of the tissue. n = 16 regions of interest. Two-tailed Mann–Whitney test. g, Western blot analysis of HIF1A in unpaced EHTs or EHTs tachypaced for 5 days. Expression levels were normalized against the unpaced EHTs. n = 4 EHTs per group (SCVI-273). Unpaired Student’s t-test. h, Lactate was measured from the extracellular medium of unpaced EHTs (indicated by blue) and tachypaced EHTs (indicated by red) on day 3 and day 5 of pacing. n = 4 samples per group. Unpaired Student’s t-test. i, OCR measurement of unpaced or tachypaced EHTs by Seahorse analysis. n = 8 EHTs per group (SCVI-273). j, OCR of control and tachypaced EHTs at baseline. k, OCR of unpaced and tachypaced EHTs measured after dobutamine (10 μM) treatment. Two-tailed Mann–Whitney test. l, Analysis of human data identifies tachycardia-specific genes exclusively upregulated in failing hearts with tachycardia but not in those without. The results of pathway enrichment analysis are presented in a bubble diagram. m, Expression of hypoxia genes VEGF, MB, tissue-type plasminogen activator (PLAT) and periostin (POSTN) in patients with non-failing hearts (n = 14), patients with HF (n = 16) or patients with HF and tachycardia (n = 19). The y axes were shown in a linear scale for VEGF and MB and a log scale for PLAT and POSTN. One-way ANOVA with Tukey’s multiple comparisons test (for VEGF and MB) or Kruskal–Wallis with Dunn’s multiple comparisons test (for PLAT and POSTN). Data are displayed as mean ± s.e.m.
