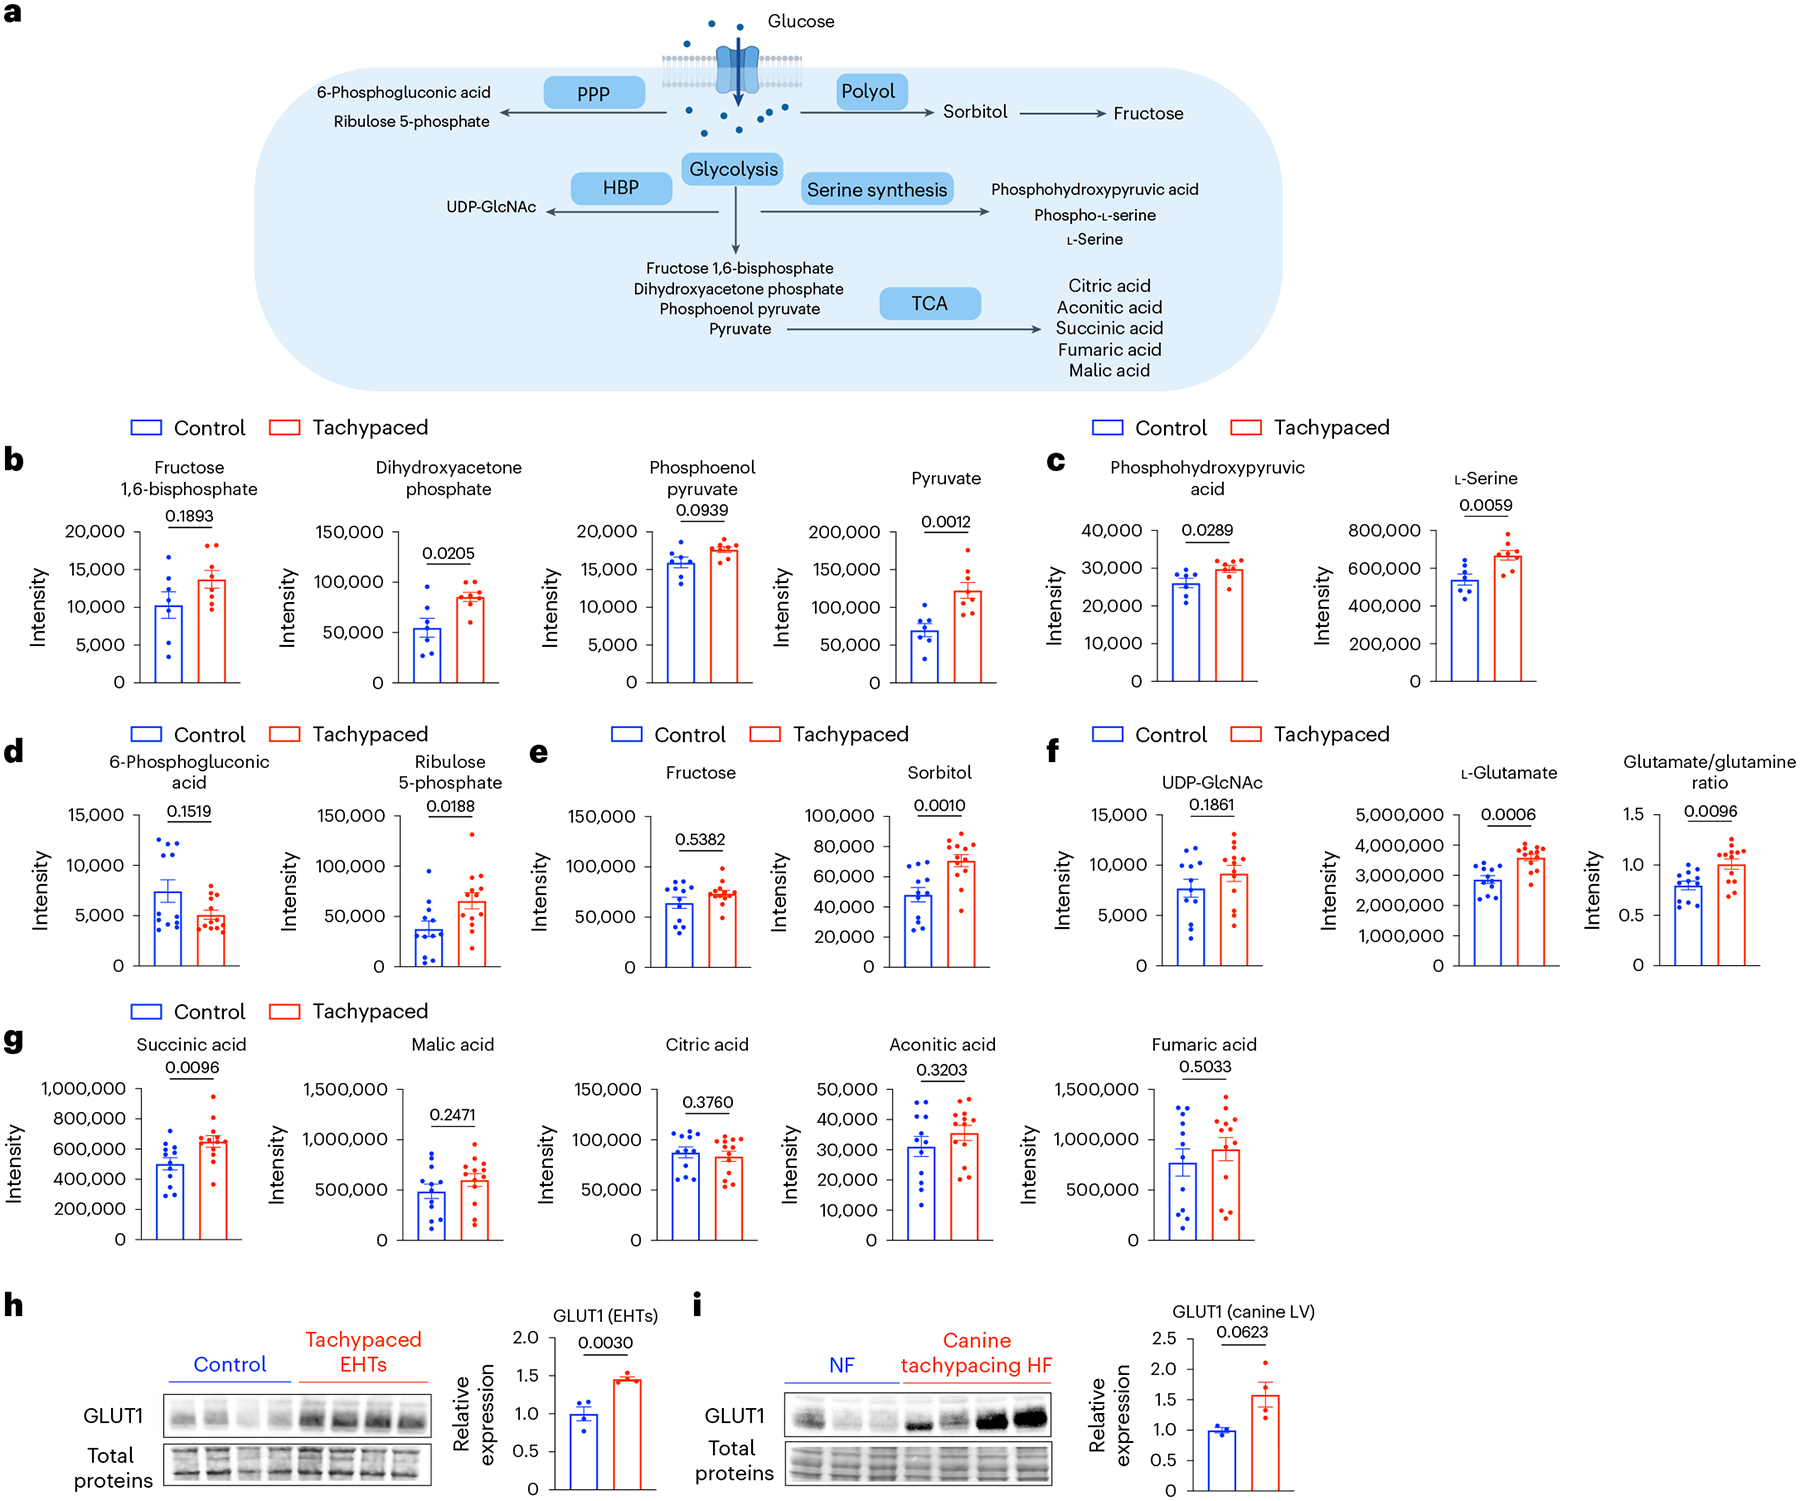
Fig. 7 |. Increased glucose utilization in tachypaced EHTs.

a, Key pathways and metabolites of glucose metabolism. EHTs from line SCVI-273 were tachypaced (indicated by red) or unpaced (indicated by blue) for 5 days at 3 Hz, followed by metabolomic analysis. Parts of the illustration were created with BioRender. b, Quantification of glycolysis metabolites: fructose 1,6-biphosphate, dihydroxyacetone phosphate, phosphoenol pyruvate and pyruvate (n = 7 control EHTs and n = 8 tachypaced EHTs). c, Quantification of serine biosynthesis pathway metabolites: phosphohydroxypyruvic acid and serine (n = 7 control EHTs and n = 8 tachypaced EHTs). d, Quantification of the PPP pathway metabolites: 6-phosphogluconic acid and ribulose 5-phosphate (n = 12 control EHTs and n = 13 tachypaced EHTs). e, Quantification of the polyol pathway metabolites: fructose and sorbitol (n = 12 control EHTs and n = 13 tachypaced EHTs). f, Quantification of the HBP pathway metabolites: UDP-GlcNAc, glutamate and the glutamate/glutamine ratio (n = 12 control EHTs and n = 13 tachypaced EHTs). g, Quantification of TCA cycle metabolites: succinic acid, malic acid, citric acid, aconitic acid and fumaric acid (n = 12 control EHTs and n = 13 tachypaced EHTs). For b–g, a two-tailed Mann–Whitney test was applied. h, Western blot analysis of GLUT1 in unpaced or tachypaced EHTs. n = 4 EHTs per group. i, Western blot analysis of GLUT1 in canine left ventricle tissue with or without tachypacing-induced HF. n = 3 NF dogs and n = 4 HF dogs. For h and i, data were normalized against the control EHTs and the NF dogs, respectively. Unpaired Student’s t-test. Data are displayed as mean ± s.e.m.
