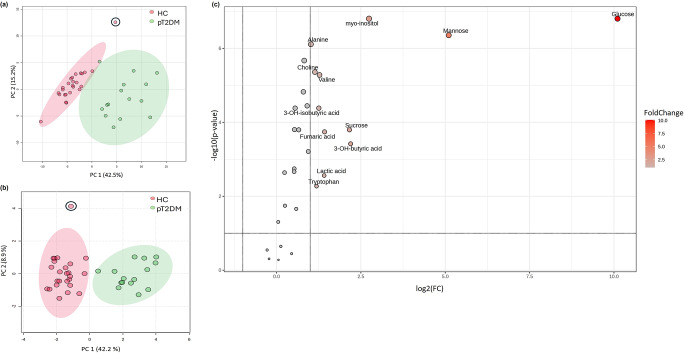
Fig. 1.
Bin and metabolite PCA results and a volcano plot. (a) The PCA score plot illustrates a natural differentiation in the bin data of the urine metabolome profiles of the 25 healthy control (HC) (pink circle) and 15 poorly controlled type 2 diabetes (pT2D) (green circle) participants. (b) The PCA score plot illustrates natural differentiation in the 25 metabolites of the urine metabolome profiles of the 25 HC (pink circle) and 15 pT2D (green circle) participants. (c) The volcano plot visually depicts metabolites based on their combined biological and statistical significance. Non-parametric FDR-adjusted p-values, log transformed with base 10, are depicted on the y-axis, with a significance threshold of 0.1, making no assumption on the equality of group variances. The x-axis represents log2 scaled fold change (FC) values considered practically relevant if |FC| ≥ 2.0 when comparing metabolite profiles of the poorly controlled type 2 diabetes cohort relative to the healthy control cohort. *The circled participant has been classified as an outlier

