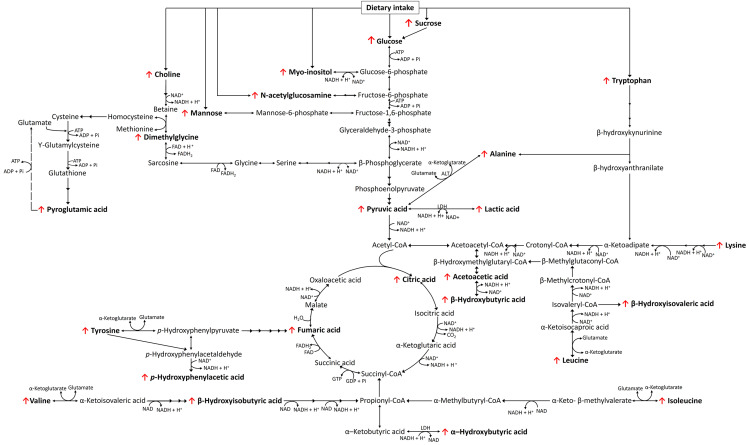
Fig. 2.
A schematic summary of the metabolic changes associated with poorly controlled type 2 diabetes in this metabolomics investigation. The directional changes in the concentrations of the metabolite markers are shown to increase (↑) or decrease (↓) relative to the healthy control group. FAD flavin adenine dinucleotide, FADH flavin adenine dinucleotide + hydrogen, NAD nicotinamide adenine dinucleotide, NADH nicotinamide adenine dinucleotide + hydrogen, ATP adenosine triphosphate, ADP adenosine diphosphate

