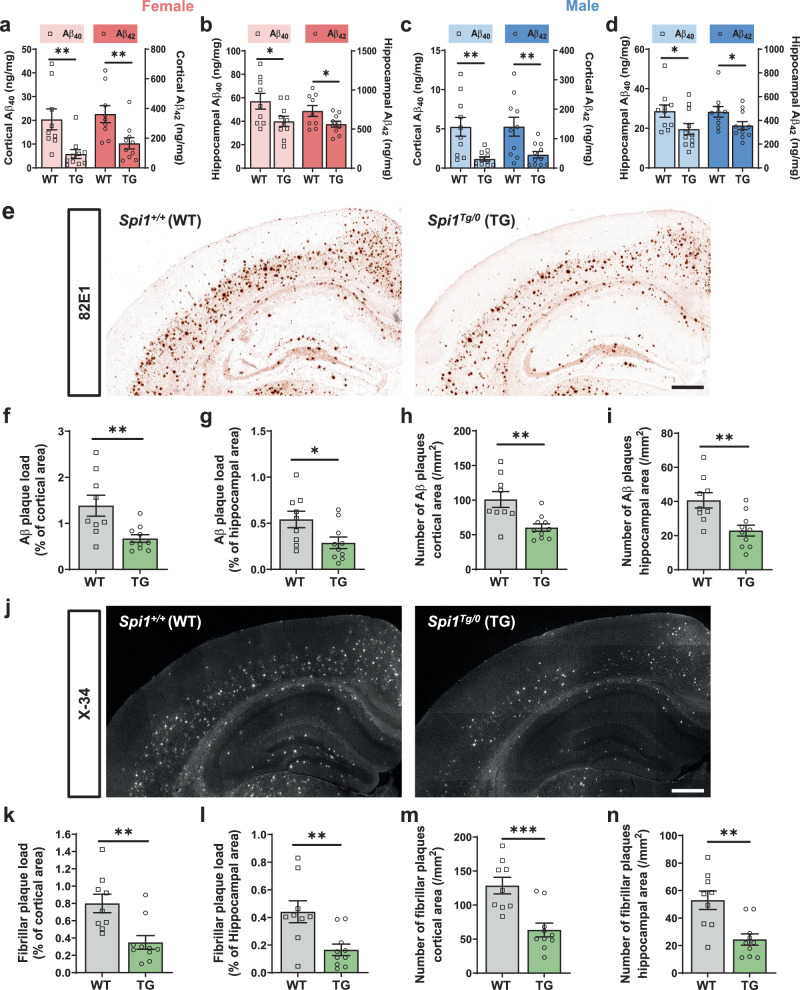
Fig. 3. Overexpression of Spi1 reduces plaque deposition in a mouse model of Aβ amyloidosis.
The levels of insoluble Aβ40 and Aβ42 were measured in female (a, b) and male (c, d) 5XFAD mice using Meso Scale Discovery (MSD) Aβ assay. Aβ40 and Aβ42 levels in the guanidine fraction from the cortex (a, c) and hippocampus (b, d) of Spi1+/+;5XFAD and Spi1Tg/0;5XFAD mice. All values are mean ± SEM. *p < 0.05 and **p < 0.01 (unpaired, two-tailed t-test; WT, n = 9 for female Spi1+/+;5XFAD, n = 10 for male Spi1+/+;5XFAD; TG, n = 10 for female Spi1Tg/0;5XFAD, n = 11 for male Spi1Tg/0; 5XFAD). e Representative images of 82E1-positive Aβ plaques in brain sections from Spi1+/+;5XFAD and Spi1Tg/0;5XFAD mice. Scale bars, 500 μm. Quantification of Aβ plaque load (f, g) and total number of Aβ plaques (h, i) in the cortical (f, h) and hippocampal (g, i) area of female Spi1+/+;5XFAD and Spi1Tg/0;5XFAD mice. All values are mean ± SEM. *p < 0.05 and **p < 0.01 (unpaired, two-tailed t-test; WT, n = 9 for Spi1+/+;5XFAD; TG, n = 10 for Spi1Tg/0;5XFAD). j Representative images of X-34-positive fibrillar plaques in brain sections from female Spi1+/+;5XFAD and Spi1Tg/0; 5XFAD mice. Scale bars, 500 μm. Quantification of fibrillar plaque load (k, l) and total number of fibrillar plaques (m, n) in the cortical (k, m) and hippocampal (l, n) of female Spi1+/+;5XFAD and Spi1Tg/0;5XFAD mice. All values are mean ± SEM. **p < 0.01 and ***p < 0.001 (unpaired, two-tailed t-test; WT, n = 9 for Spi1+/+;5XFAD; TG, n = 10 for Spi1Tg/0;5XFAD). Source data are provided as a Source data file.

