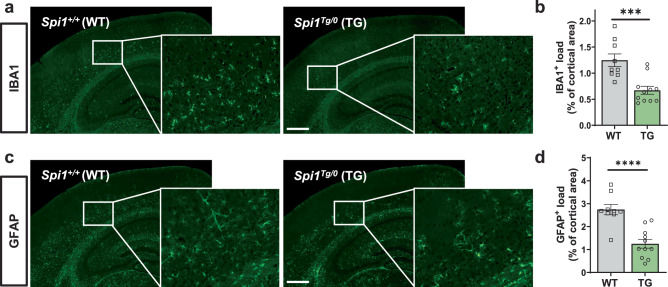
Fig. 4. Spi1-overexpression decreases microgliosis and astrogliosis in a mouse model of Aβ amyloidosis.
a Representative images of IBA1-positive cells in brain slices from female Spi1+/+;5XFAD and Spi1Tg/0;5XFAD mice. Scale bars, 500 μm. b Quantification of the IBA1-positive cell load in the cortical area. c Representative images of GFAP-positive cells in brain slices from female Spi1+/+;5XFAD and Spi1Tg/0; 5XFAD mice. Scale bars, 500 μm. d Quantification of the GFAP-positive cell load in the cortical area. All values are mean ± SEM. ***p < 0.001 and ****p < 0.0001 (unpaired, two-tailed t-test; WT, n = 9 for Spi1+/+;5XFAD; TG, n = 11 for Spi1Tg/0; 5XFAD). Source data are provided as a Source data file.

