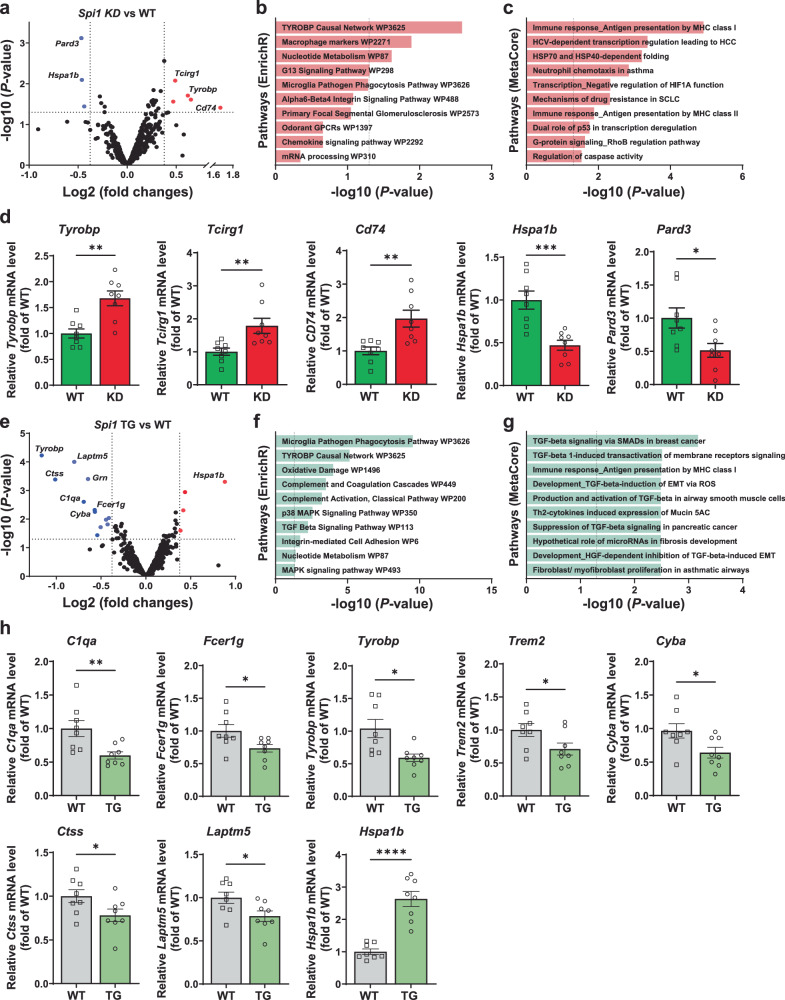
Fig. 5. Analyses of transcriptomic changes induced by Spi1-knockdown and Spi1-overexpression in Aβ amyloidosis mouse models.
a–c Differentially expressed genes (DEGs) in cortex of Spi1+/−;APP/PS1 versus Spi1+/+;APP/PS1 mice identified by NanoString analysis and their pathway enrichment analyses. a Volcano plot showing DEGs in Spi1+/−;APP/PS1 mice compared to Spi1+/+;APP/PS1 mice (n = 3 males per genotype). The red dots represent significantly upregulated genes, and blue dots represent significantly downregulated genes in Spi1+/−;APP/PS1 versus Spi1+/+;APP/PS1 mice (p < 0.05, indicated as a horizontal dash line; fold change > ±1.3, indicated as a vertical dash line). The volcano plot shows statistical significance as the -log10 P-value (y-axis) and the log2 Fold Change (log2FC, x-axis). Pathway enrichment analysis with the functional annotation of DEGs was performed using EnrichR (b) and MetaCore (c) software. d, qPCR analysis of several DEGs in cortex between Spi1+/−;APP/PS1 mice and Spi1+/+;APP/PS1 mice. All values are mean ± SEM. *p < 0.05, **p < 0.01, and ***p < 0.001 (unpaired, two-tailed t-test; WT, n = 8 (n = 4 males, n = 4 females) for Spi1+/+;APP/PS1; KD, n = 8 (n = 4 males, n = 4 females) for Spi1+/−;APP/PS1). e–h DEGs in cortex of Spi1Tg/0;5XFAD versus Spi1+/+; 5XFAD mice identified by NanoString analysis and pathway enrichment analyses. e Volcano plot showing DEGs in Spi1Tg/0;5XFAD versus Spi1+/+;5XFAD mice (n = 3 females per genotype). The volcano plot shows statistical significance as the -log10 P-value (y-axis) and the log2FC (x-axis). The red and blue dots represent significantly upregulated and downregulated genes, respectively, in Spi1Tg/0;5XFAD versus Spi1+/+;5XFAD mice (p < 0.05, indicated as a horizontal dash line; fold change > ±1.3, indicated as a vertical dash line). Pathway enrichment analysis of DEGs identified using EnrichR (f) and MetaCore (g) software. h qPCR analysis of several DEGs in cortex between females Spi1Tg/0;5XFAD mice and Spi1+/+;5XFAD mice. All values are mean ± SEM. *p < 0.05, **p < 0.01, and ****p < 0.0001 (unpaired, two-tailed t-test; WT, n = 8 for Spi1+/+;5XFAD; TG, n = 8 for Spi1Tg/0;5XFAD). P-values of b and f were calculated using two-tailed Fisher’s exact test, while those for c and g were determined using Metacore algorithms, both with a threshold of significant enrichment as p < 0.05 (shown as a vertical dash line for b, c, f, and g). Source data are provided as a Source data file.

