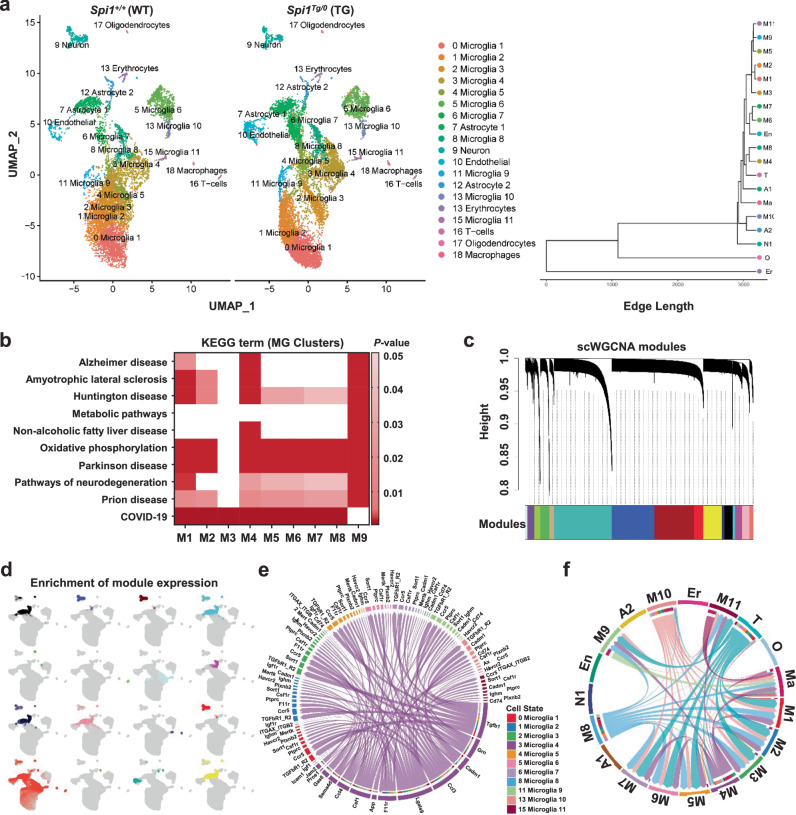
Fig. 9. Analyses of transcriptomic changes and cell-type specific gene expression signatures induced by Spi1-overexpression in an Aβ amyloidosis mouse model.
a–f scRNA-seq analysis identified 19 clusters of cell types in 4-month-old Spi1+/+;5XFAD and Spi1Tg/0;5XFAD mouse brains. a UMAP plots showing the 19 annotated cell type clusters for each genotype. The clustering dendrogram shows cluster relatedness. b Heatmap of KEGG terms generated from microglial cluster DEGs. P-values of KEGG term enrichment were calculated in Gprofiler2 using a two-tailed Fisher’s exact test with significant enrichment as p < 0.05. Darker colors represent greater term enrichment in each gene list. c Sixteen co-expressed gene modules were identified using Single Cell Weighted Gene Network Correlation Analysis (scWGCNA). d UMAP plot showing the enrichment of 16 co-expressed gene modules across different clusters. e Chord Plot showing that microglial cluster 4 signals to other microglial clusters. The color of each outer band represents the identity of each cell cluster. Inner bands for the cluster 4 microglia represent the identity of each cell cluster that expresses a particular receptor or an interacting protein for the ligand expressed in the cluster 4 microglia. The color of these inner bands is based on the cell cluster targeted by the cluster 4 microglia. f CCL Signaling Chord Plot showing CCL pathway signaling between microglial clusters. The color of the outer bands and chords represents the identity of the cell cluster (M1-11 = microglia, A1-2 = astrocytes, En = endothelial cells, Er = erythrocytes, Ma = macrophages, N1 = neurons, O = oligodendrocytes, and T = T-cells). The color of the inner bands is based on the identity of the cell cluster targeted. Source data are provided as a Source data file.

