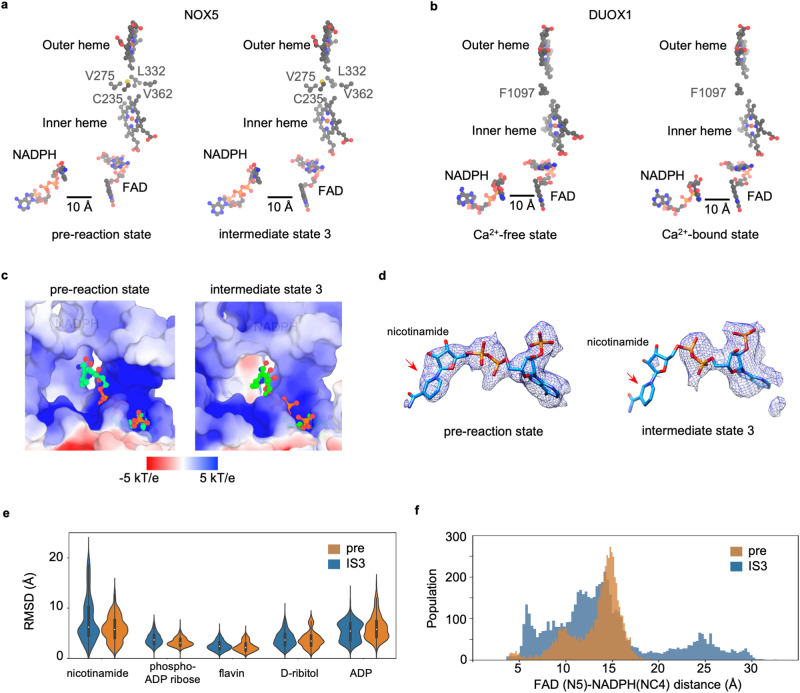
Fig. 3. Activation of human NOX5.
Electron transfer pathway in human NOX5 (a) and DUOX1 (b) before and after Ca2+ activation. Side chains of residues between two hemes are shown. c Electrostatic representation of the NOX5 NADPH binding pockets for pre-reaction state and intermediate state 3. d Cryo-EM density of NADPH in pre-reaction state and intermediate state 3. Nicotinamide group is indicated with red arrow. e The RMSD of chemical groups from NADPH and FAD in pre-reaction state and intermediate state 3. For pre-reaction state, the minima, maxima, centre, 25% percentile and 75% percentile of nicotinamide group are 0.03, 15.07, 5.77, 4.13 and 7.58, respectively. The minima, maxima, centre, 25% percentile and 75% percentile of phosphor-ADP ribose group are 0.03, 7.44, 3.10, 2.62 and 3.81, respectively. The minima, maxima, centre, 25% percentile and 75% percentile of flavin group are 0.04, 6.13, 2.17, 1.65 and 2.93, respectively. The minima, maxima, centre, 25% percentile and 75% percentile of D-ribitol group are 0.03, 8.96, 3.49, 2.60 and 4.49, respectively. The minima, maxima, centre, 25% percentile and 75% percentile of ADP group are 0.04, 15.86, 5.79, 4.32 and 7.41, respectively. For intermediate state 3, the minima, maxima, centre, 25% percentile and 75% percentile of nicotinamide group are 0.00, 22.51, 6.27, 4.58 and 10.20, respectively. The minima, maxima, centre, 25% percentile and 75% percentile of phosphor-ADP ribose group are 0.00, 8.23, 3.70, 2.95 and 4.62, respectively. The minima, maxima, centre, 25% percentile and 75% percentile of flavin group are 0.00, 6.54, 2.41, 1.86 and 3.11, respectively. The minima, maxima, centre, 25% percentile and 75% percentile of D-ribitol group are 0.00, 10.41, 3.66, 2.70 and 4.81, respectively. The minima, maxima, centre, 25% percentile and 75% percentile of ADP group are 0.00, 13.74, 5.47, 3.70 and 6.95, respectively. The bar covers 25% and 75% of the data. All data are plotted on the violin plot. Pre and IS3 represent pre-reaction state and intermediate state 3, respectively. Data in all triplicates are combined to a single histogram. f Distance distribution between FAD and NADPH in pre-reaction state and intermediate state 3. Pre and IS3 represent pre-reaction state and intermediate state 3, respectively. Data in all triplicates are combined to a single histogram.

