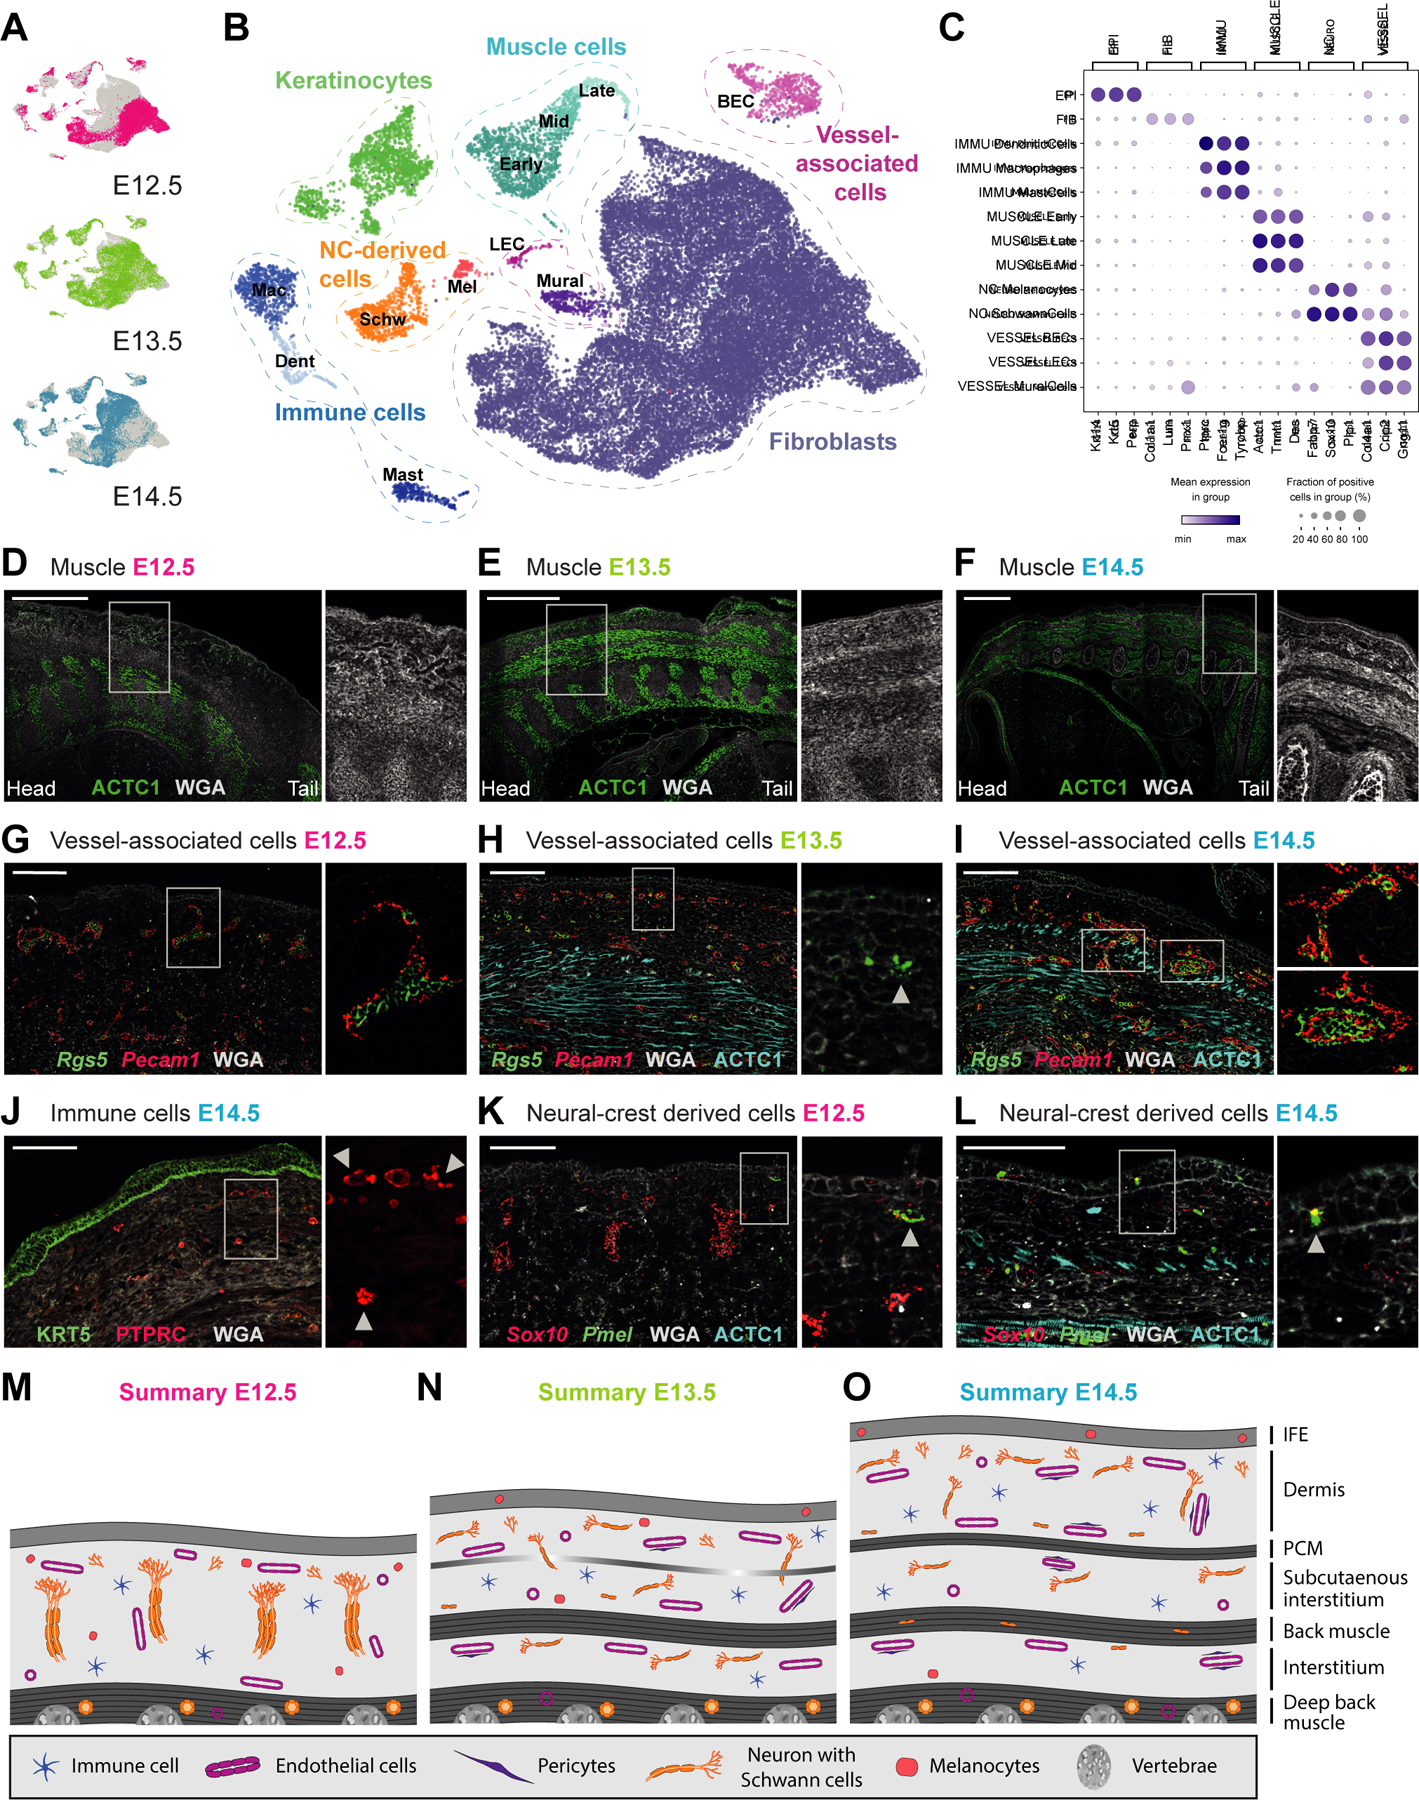
Figure 1. Anatomy of embryonic skin from E12.5, E13.5, and E14.5.

(A) UMAP visualization of all cells from the different embryonic ages (n = 11 280 cells of E12.5, 9 964 of E13.5, and 10 950 of E14.5).
(B) UMAP visualization of first-level clustering of all cells (n = 32 194 cells).
(C) Marker gene expression dot plot for main cell classes.
(D-L) mRNA (italics) and protein (capital letters) stainings revealing the major anatomical landmarks of dorsal embryonic skin (sagital sections). Microscope images originate from larger tile scans (n = 3 mice). Scale bars, 500μm (D-F) and 100μm (G-L). * denotes erythrocyte autofluoresence
(D-F) Muscle layers (ACTC1) with zoom ins to visualize anatomical layers using membraneous counterstain with WGA. M marks developing muscle layers.
(G-I) Endothelial (Pecam1) and mural (Rgs5) cells. Arrowhead in (H) marks earliest evidence of mural cells at E13.5. Upper zoom in in (I) shows smaller vessel with discontinuous mural cell lining while lower zoom in in (I) shows larger vessel with continuous mural cell lining.
(J) Immune cells (PTPRC) and epidermis (KRT5). Arrowheads highlight immune cells with dendritic phenotype.
(K-L) Melanocytes (Sox10 + Pmel) and Schwann cells (Sox10). Arrowhead shows the arrival of melanocytes in the epidermis.
(M-O) Schemes summarizing anatomical landmarks at E12.5, E13.5 and E14.5.
See also Figure S1.
