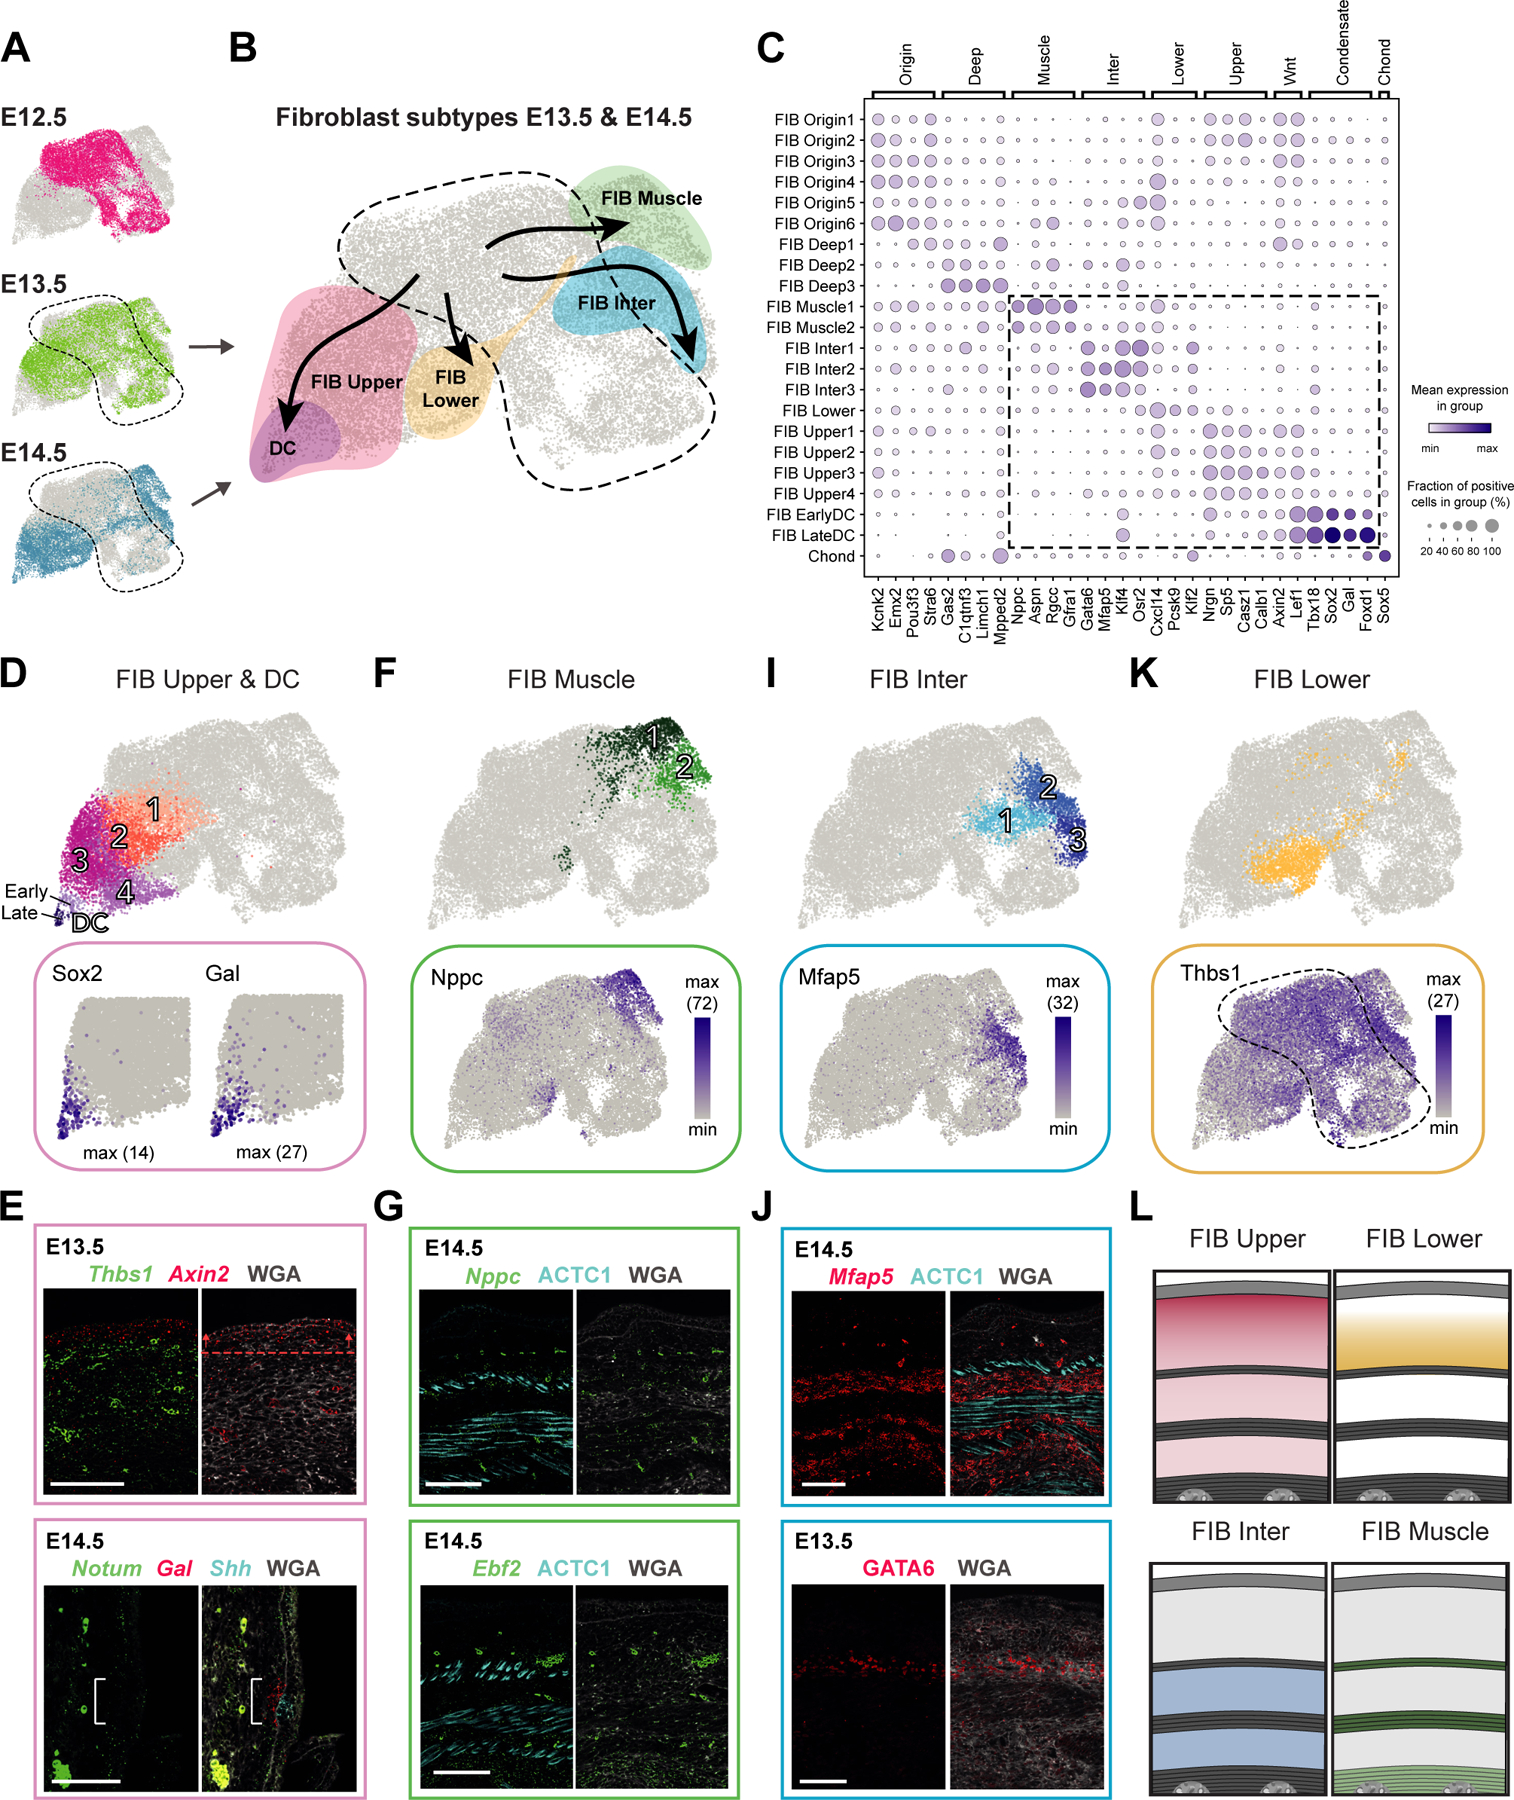
Figure 3. Deconstruction of fibroblast heterogeneity at E13.5 and E14.5 (expression and location).

(A) UMAP with fibroblasts from different embryonic ages (as shown in Fig 2A).
(B) UMAP showing major fibroblast subtypes at E13.5 and E14.5 together with their differentiation trajectories (velocity trends).
(C) Marker gene expression dot plot for major fibroblast groups. Highlighted are clusters mostly present at E13.5 and E14.5.
(D,F,I,K) Subclustering of major fibroblast groups (upper panels). Expression pattern of characteristic marker genes (lower panels).
(E,G,J) mRNA (italics) and protein (capitalized) stainings highlighting fibroblast subpopulations. Dashed line with arrows highlights the region of highest expression. Bracket shows reduced Notum expression. M marks developing muscle layers. Microscope images originate from larger tile scans (n = 3 mice). Scale bars, 100μm.
(L) Schemes summarizing major fibroblast groups at E14.5 and their location. Similar at E13.5, but PCM is not fully developed yet.
