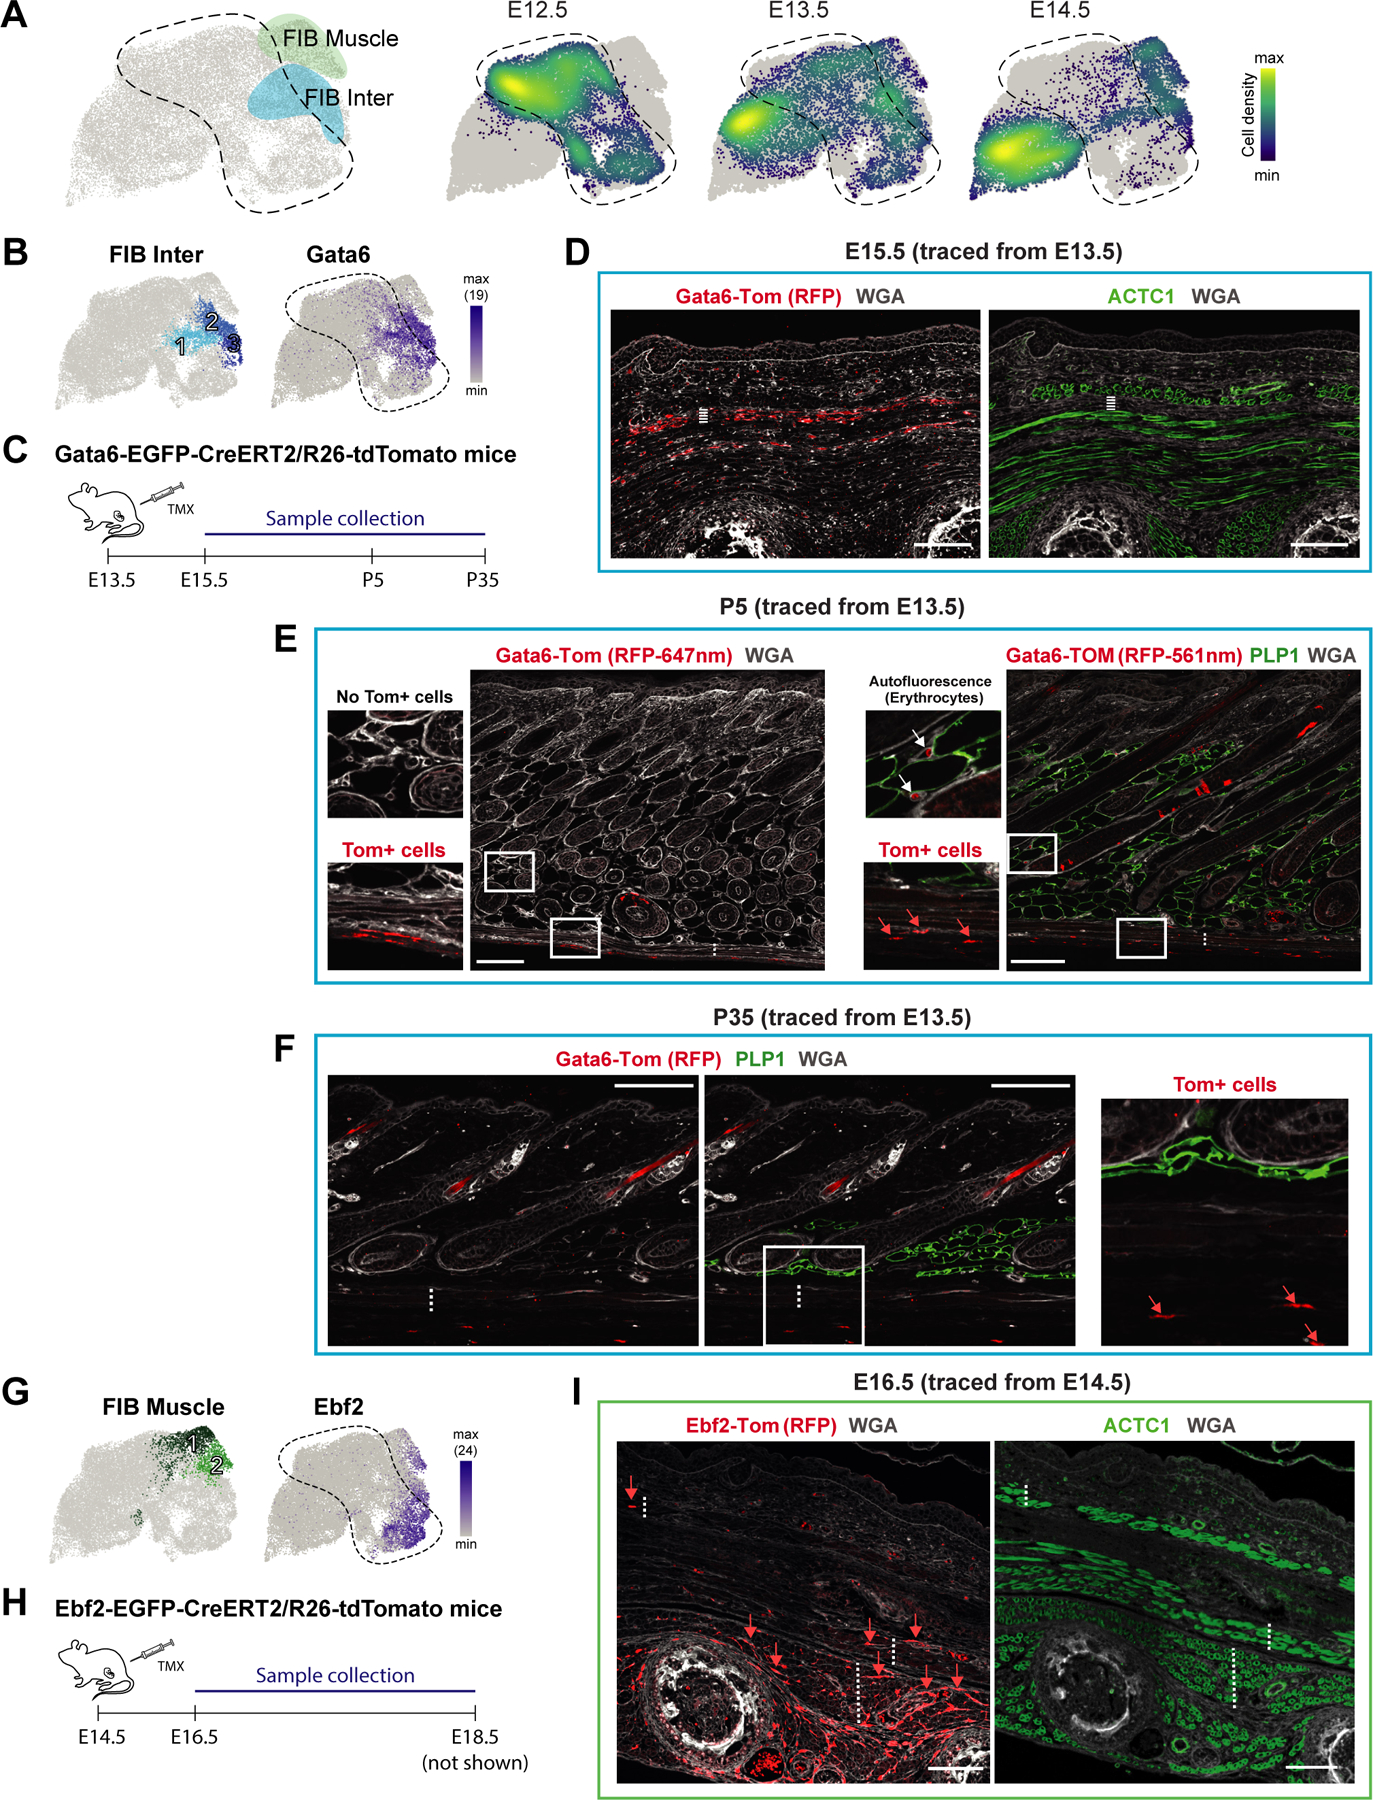
Figure 4. Tracing the fate of Ebf2+ and Gata6+ fibroblasts.

(A) FIB Muscle and FIB Inter fibroblasts highlighted on UMAP (left panel). Density plot showing the distribution of fibroblasts from the different embryonic ages on the UMAP (right panel).
(B) UMAPs with FIB Inter subpopulations (left panel) and Gata6 expression (right panel).
(C) Experimental setup for lineage tracing of Gata6+ cells.
(D) Initial 2-day-tracing pattern of Gata6+ cells (left panel) and staining of the developing muscle layers (right panel). Dashed line marks Fascia/SWAT layer on the two consecutive sections. M marks developing muscle layers. Scale bars, 100μm.
(E, F) Tracing pattern of Gata6+ cells at postnatal day 5 (P5; E) or P35 (F) and PLP1 protein staining of lipid droplets. Note the strong erythrocyte autofluorescence within DWAT at 561nm (E). Dotted lines indicate the PCM. Scale bars, 100μm.
(G) UMAPs with FIB Muscle subpopulations (left panel) and Ebf2 expression (right panel).
(H) Experimental setup for lineage tracing of Ebf2+ cells.
(I) 2-day-tracing pattern of Ebf2+ cells (left panel) and staining of the developing muscle layers (right panel). Dotted lines indicate the PCM, underlying back muscle layers (M), as well as deep-tissue interstitial space on the two consecutive sections. Scale bars, 100μm.
(D-F, I) Microscope images originate from larger tile scans (n = 3 mice).
