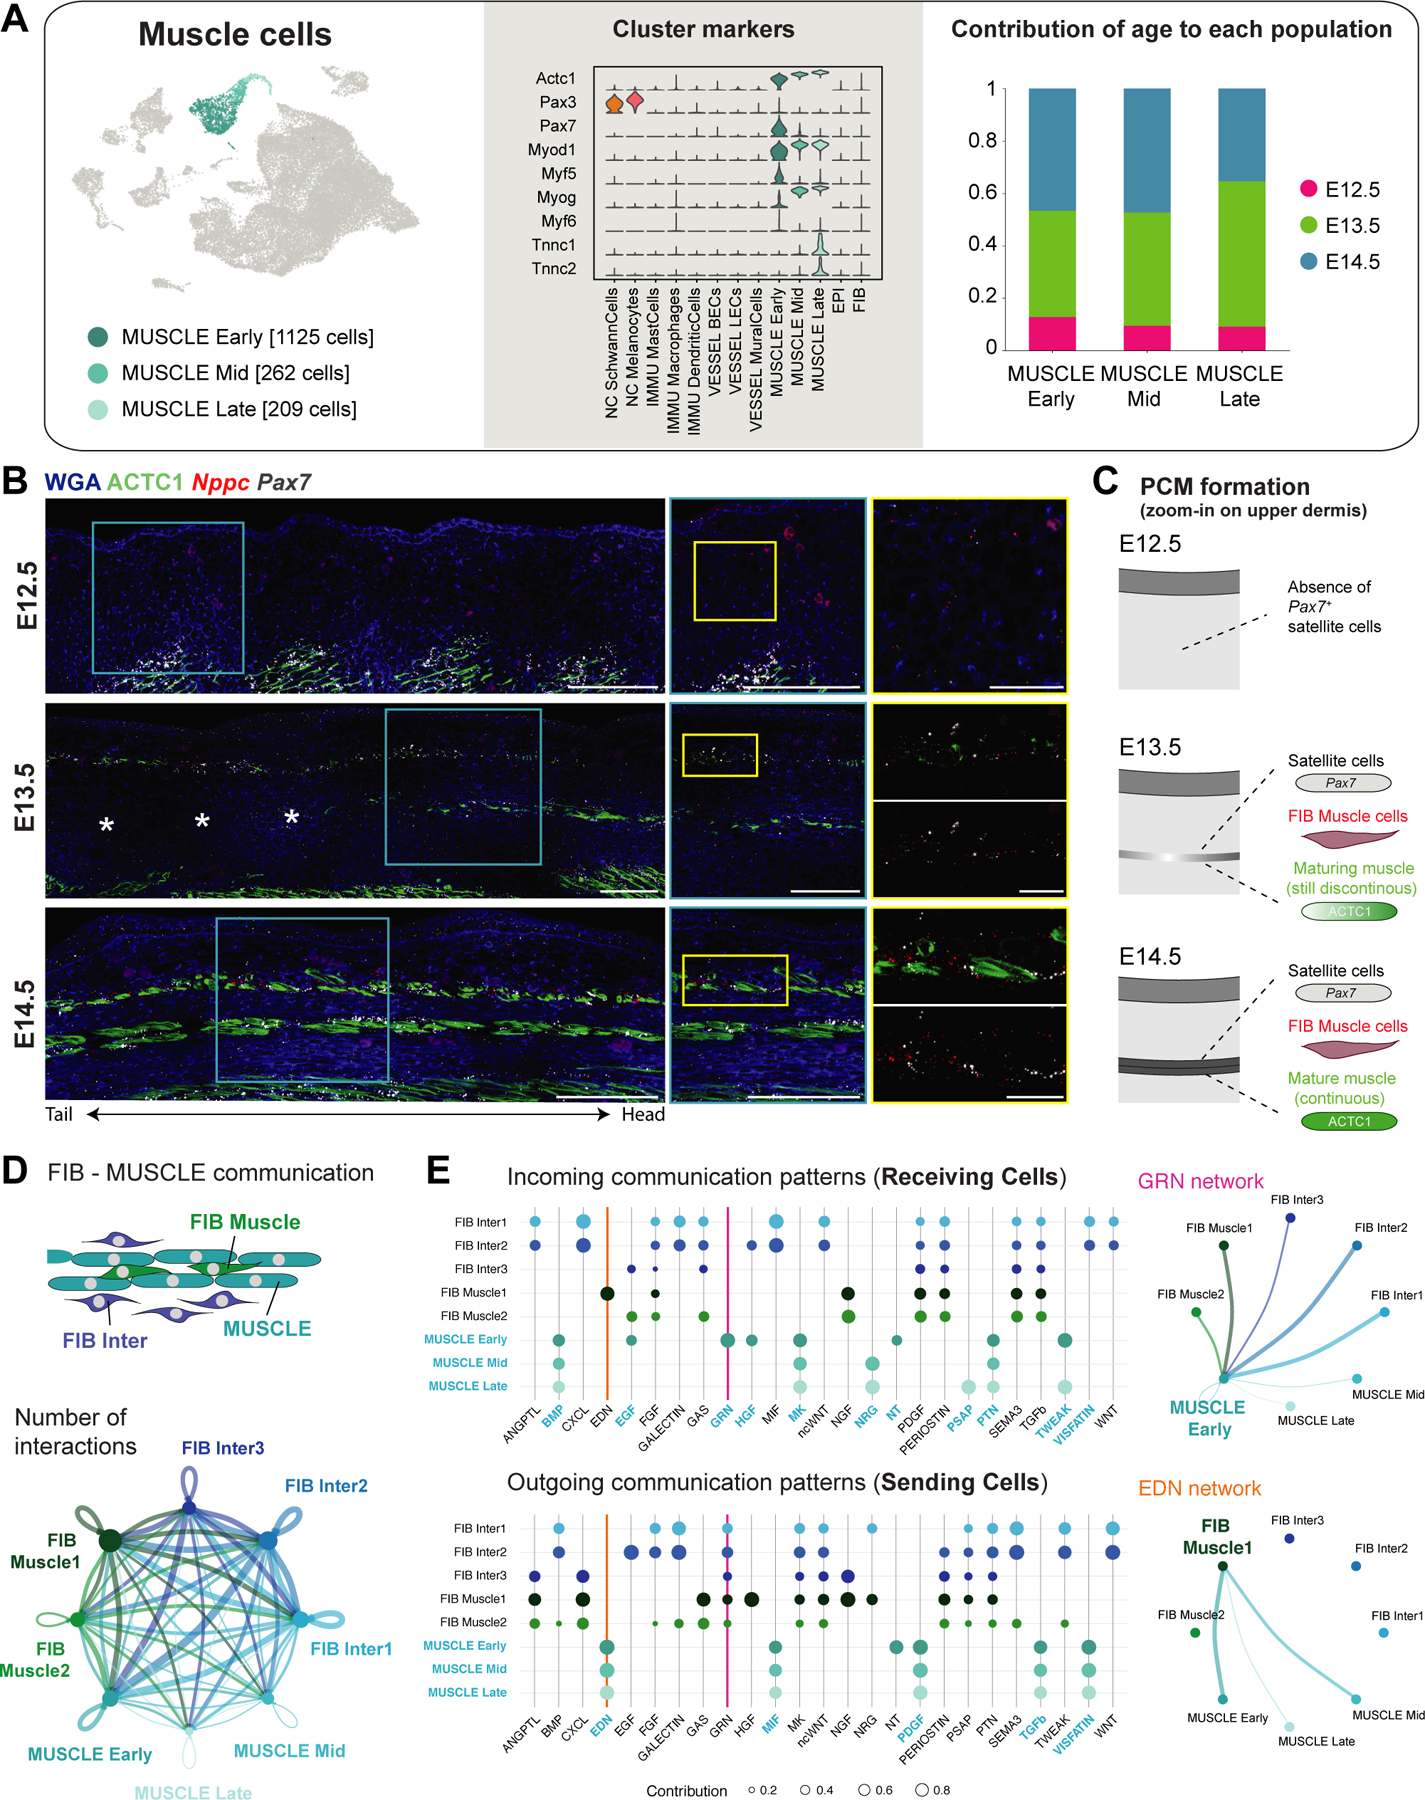
Figure 5. Developing muscle layers in embryonic skin.

(A) UMAP (from Figure 1B) with subpopulations of muscle cells (left panel), violin plot of marker gene expression (center panel), and contribution of each embryonic time point to subpopulations (right panel).
(B) mRNA (italics) and protein (capitalized) stainings highlighting developing muscle layers. Microscope images originate from larger tile scans (n = 3 mice). Scale bars, 100μm (panorama, blue zoom-in) and 25μm (yellow zoom-in). Asterisks: indicate a discontiunous upper back muscle layer (dependent on histological cut and distance to dorsal midline).
(C) Scheme of panniculus carnosus muscle (PCM) formation.
(D) Circle plot visualizing number of interactions between FIB Inter, FIB Muscle, and MUSCLE subpopulations. Edge width proportional to the number of interactions. Edges colored according to sending cell population.
(E) Dot plot showing outgoing and incoming signaling patterns between FIB Inter, FIB Muscle, and MUSCLE subpopulations (left panels). Dot size proportional to enrichment of signaling pathway in the cell population. Circle plots for selected signaling pathways with significant interactions (right panels).
