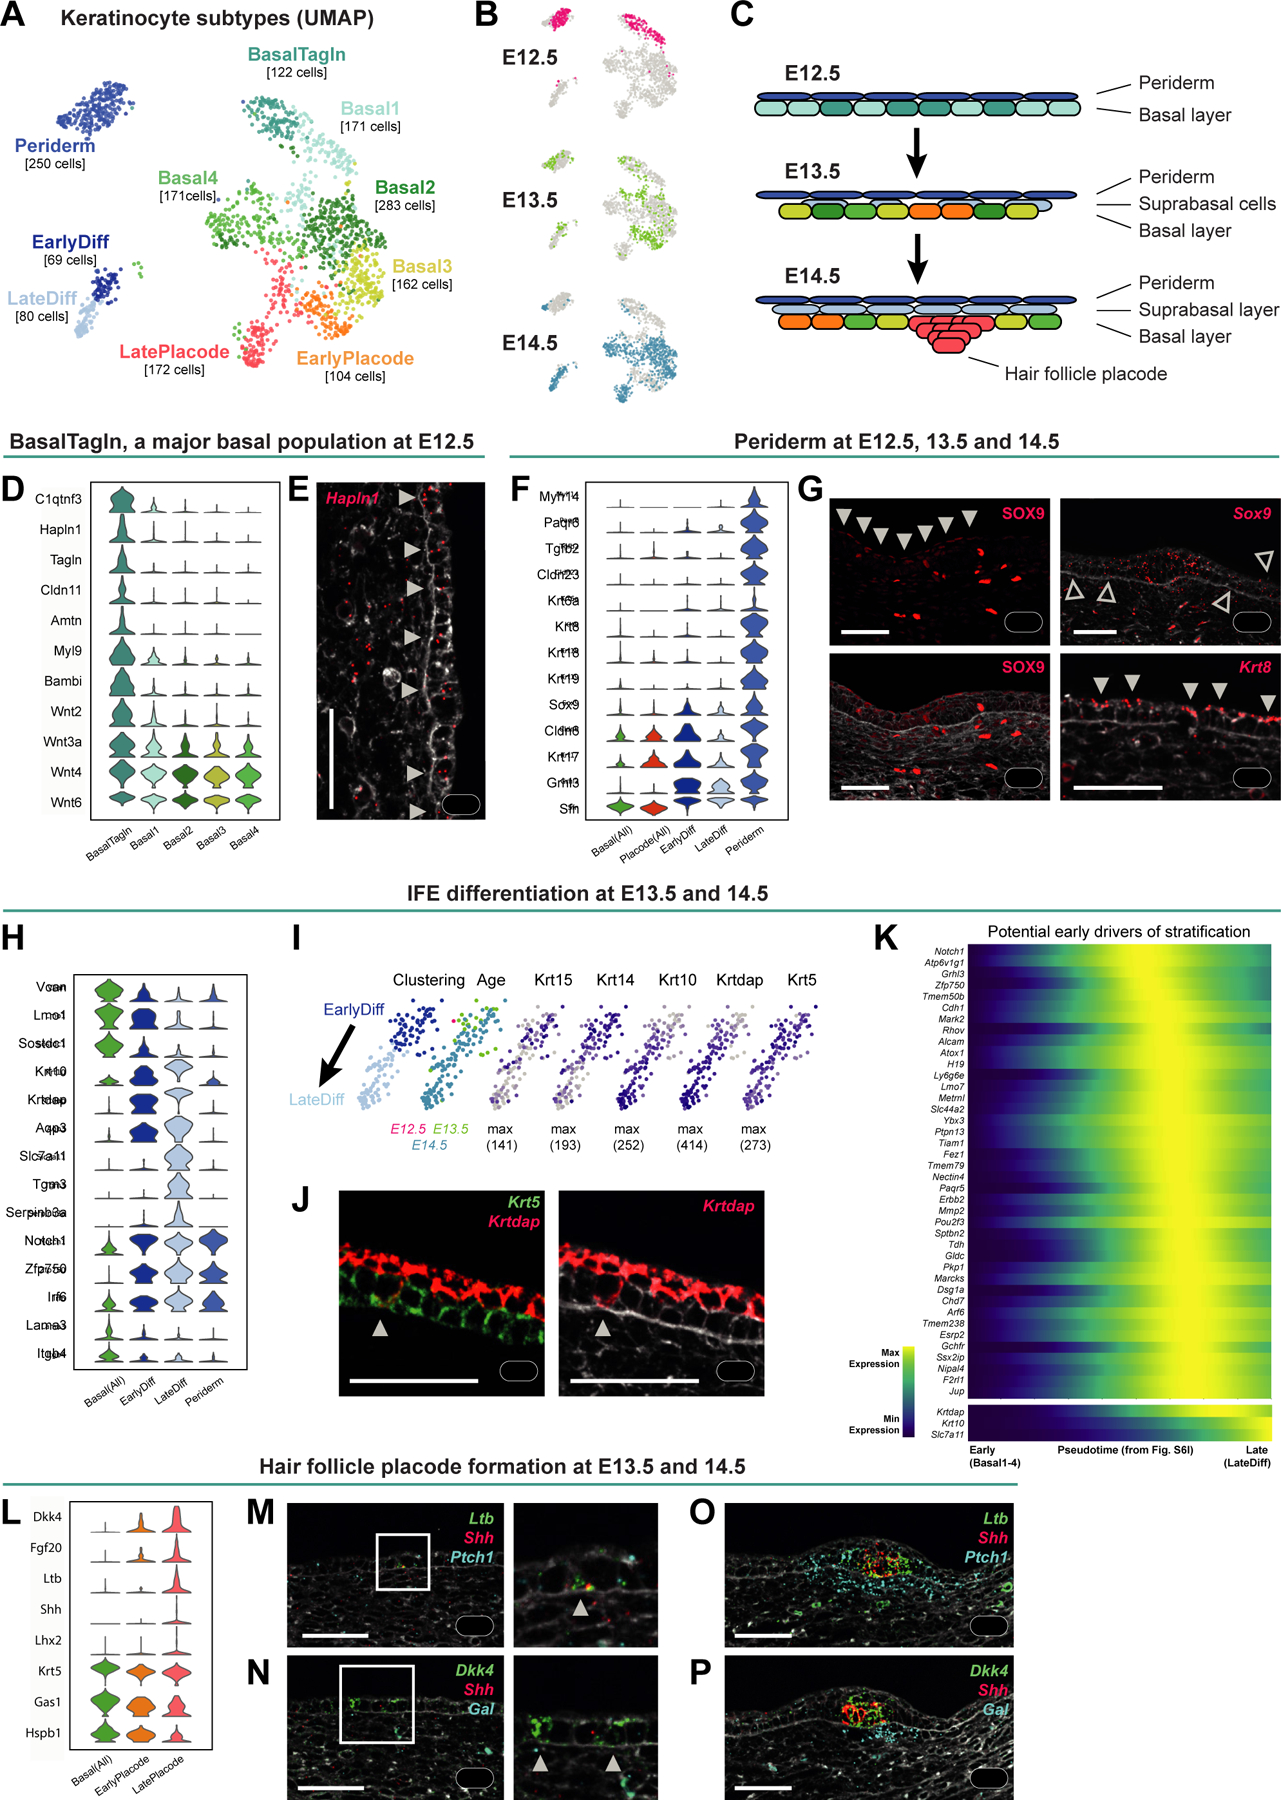
Figure 7. Epidermal development from a single basal layer towards a HF-inducing and stratified epithelium.

(A-B) UMAP visualization of all keratinocyte subclusters (A) and their embryonic ages (B; n = 360 cells of E12.5, 347 of E13.5, and 877 of E14.5).
(C) Scheme summarizing epidermis development in the analyzed time window, with cell colored according to the cluster colors in (A).
(D) Violin plot of EPI BasalTagln marker gene expression.
(E) Hapln1 mRNA staining revealing expression in basal IFE (arrowheads).
(F) Violin plots of periderm marker gene expression.
(G) SOX9 protein staining (left panels); expression in periderm (filled arrowheads) and hair placode cells (asterisks). Sox9 mRNA staining (upper right); expression in cells within and outside of hair placode (asterisk and empty arrowheads, respectively). Krt8 mRNA staining; expression in periderm cells (filled arrowheads).
(H) Violin plot of differentiation marker gene expression.
(I) UMAPs of differentiating keratinocytes (EPI EarlyDiff and EPI LateDiff from A) colored according to subclustering and embryonic age (left two panels) or expression of basal and suprabasal marker genes (right panels).
(J) Krt5 and Krtdap mRNA staining reveals a representative basal cell with a differentiation signature (arrowhead).
(K) Heatmap of potential early drivers of stratification along the pseudotime from EPI Basal1–4 to EPI EarlyDiff and EPI LateDiff cells from E14.5 (Figure S6I). Krtdap, Krt10, and Slc7a11 are plotted for comparison.
(L) Violin plot of hair placode marker gene expression.
(M-P) Ltb, Shh and Ptch1 (M, O) or Dkk4, Shh, and Gal (N, P) mRNA staining at E13.5 (M, N) and E14.5 (O, P), showing early placode cells (M-N; arrowheads) and mature hair placodes (marked by Ltb, Shh, and Dkk4) as well as dermal condensates (marked by Ptch1 and Gal).
(E, G, J, M-P) Images originate from larger tile scans (n = 3 mice). Scale bars: 50μm.
See also Figures S6 and S7 and Tables S1 and S2.
