
Fig. 2.
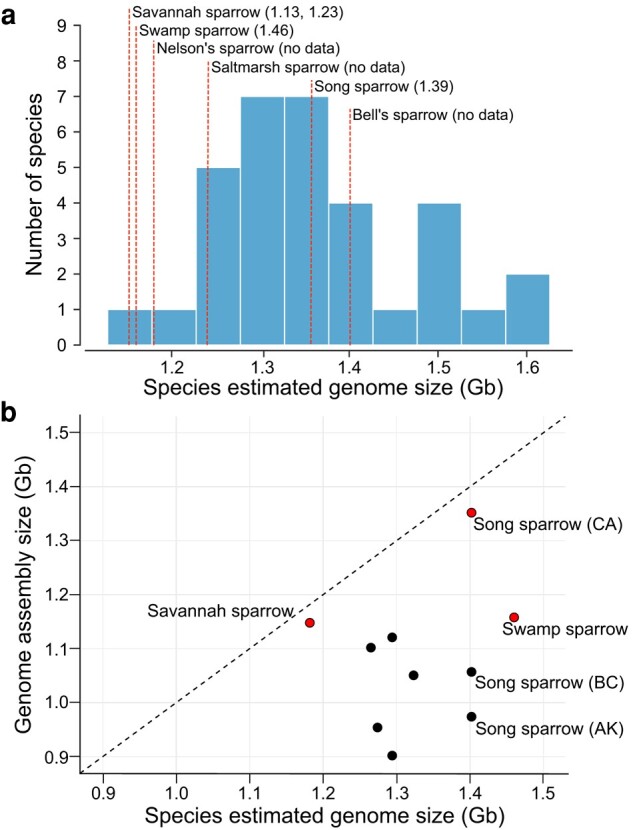
a) Histogram showing variation in the genome sizes for 21 species (33 individuals) of Passerellidae sparrows estimated from Feulgen image analysis densitometry methods. C-values were adjusted based on the assumption that 1 pg = 0.978 Gb (Dolezel et al. 2003). Genome size of the draft assemblies generated through the CCGP and VGP shown as red dashed lines with corrected c-value estimate (Gb) in parentheses. For Passerculus sandwichensis two estimates of genome size were found in the Animal Genome Size Database. b) Comparison of estimated genome size from C-values versus genome assembly size (Gb). Black dashed line indicates the 1-to-1 line indicating equal estimates of genome size from the two metrics. Red dots are newly generated assemblies reported here. Nelson's, saltmarsh, and Bell's sparrow lack independent estimates of C-values and are not shown on this plot. Black dots denote previously published genome assemblies, which all show a shorter assembly length relative to the C-value estimate of genome size.