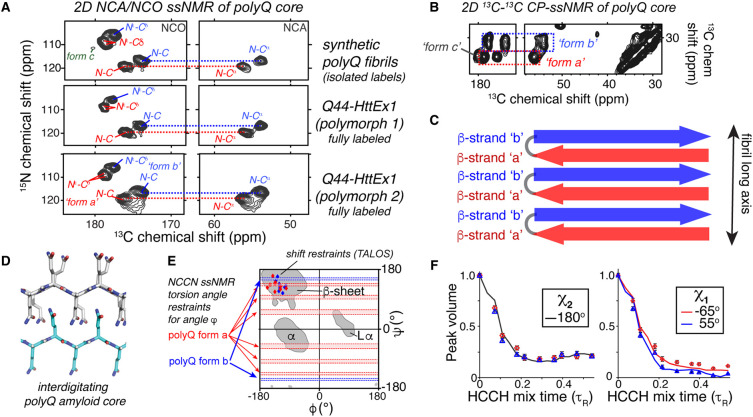
Figure 2. Example ssNMR data on the structure of polyQ amyloid cores.
(A) Comparison of 2D 13C-15N ssNMR spectra (NCA and NCO spectra) for three different polyQ aggregates, showing identical chemical shifts for the polyQ core. The ssNMR signature of the polyQ core features two sets of signals, coined forms a and b (marked in red and blue, respectively), in equal intensities. Note that the bottom samples are fully labeled HttEx1 protein fibrils, whilst the top shows a sample in which only two glutamines are selectively 13C,15N-labeled. (B) Part of a 2D 13C-13C CP-DARR ssNMR spectrum showing the same two glutamine conformers, in equal intensities. A smaller third peak (form c) is attributed to residues outside the buried core. (C) Schematic showing the molecular origin of the red/blue conformers (forms a/b) in the antiparallel β-sheets of polyQ amyloid. (D) Published schematic showing the glutamine side chain interdigitation in the core, based on ssNMR structural analysis. (E) PolyQ torsion angle ssNMR restraints for the backbone dihedral angles, shown in a Ramachandran plot. Horizontal red/blue areas mark permitted regions based on dipolar recoupling measurements of the Ψ angle (NCCN experiments), while the diamonds mark chemical-shift-based estimates from the TALOS program. (F) ssNMR data curves that constrain the side chain torsion angles χ1 and χ2 of polyQ amyloid, based on HCCH-type dihedral angle measurements. The red and blue datapoints represent the two Gln conformers, along with lines showing the best-fit dihedral angles. (A,B–F) Adapted with permission from Hoop et al. [28].

