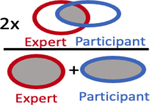
Table 3:
Summary of accuracy statistics comparing participant volumes to expert volume
| Graphical Equation | Without RSIrs | With RSIrs | |
|---|---|---|---|
| # of Complete Misses across all participants |

|
134/762 (17.6%) | 18/842 (2.1%) |
| # of participants with at least 1 Complete Miss | 40 (91%) | 13 (30%) | |
| % of each participant’s attempts resulting in a Complete Miss, median (IQR) | 13.6% (9.1 – 23.6%) | 0.0% (0.0 – 4.3%) | |
|
| |||
| Conformal Number, median (IQR) |

|
0.26 (0.06 – 0.43) | 0.45 (0.35 – 0.55) |
|
| |||
| Dice Coefficient, median (IQR) |

|
0.48 (0.18 – 0.64) | 0.66 (0.55 – 0.73) |
|
| |||
| Maximum Distance to Expert, median (IQR) |

|
13.7mm (8.1 – 23.4) | 9.17mm (6.3 – 14.9) |
|
| |||
| % Overlap with Expert, median (IQR) |

|
40.8% (12.6 – 64.0%) | 77.6% (58.9 – 89.5%) |
Summary of metrics evaluating participant volumes relative to the expert volume. 44 participants generated 762 volumes on conventional MRI without RSIrs and 842 with RSIrs available for analysis (there were two more cases with RSIrs than without RSIrs).
