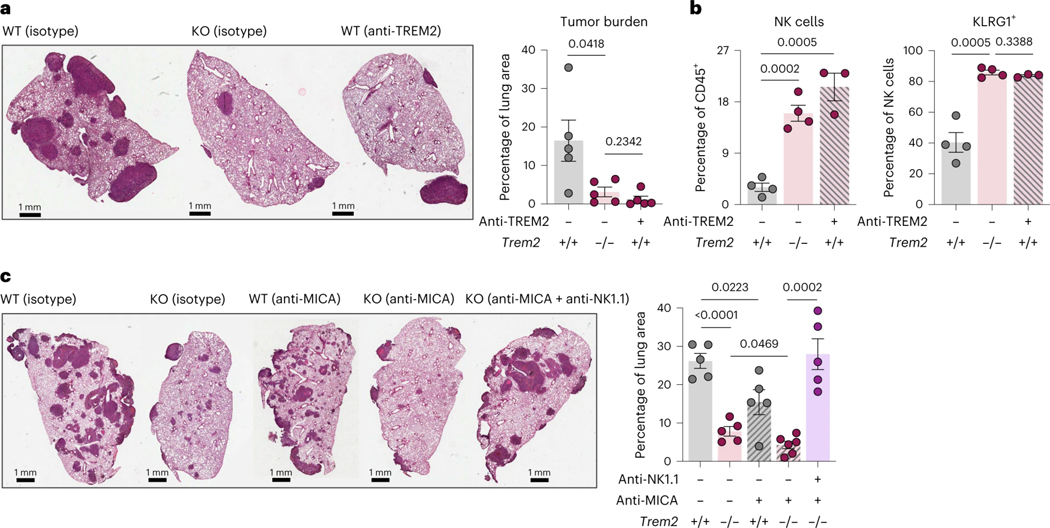
Figure 5. Therapeutic inhibition of TREM2 synergizes with an NK cell stabilizing agent to promote superior NK cell immunity and tumor elimination.
a) Representative H&E images of tumor-bearing lungs of WT, isotype antibody (n = 5), KO, isotype antibody (n = 5), KO that received the TREM2 blocking antibody (αTREM2) (n = 5) (left). Quantification of the tumor area as a percent of the total area of the lung cross-section (right) is shown. (mean ± standard error of mean (S.E.M.); unpaired two-tailed t-test at a 95% confidence interval)
b) Flow cytometric quantification of NK cells, as a relative frequency of CD45+ immune cells (left), and KLRG1-expressing NK cells, as a relative frequency of total NK cells (right), in the tumor-bearing lungs of WT mice and KO mice that were treated with either an isotype control or the αTREM2 antibody. (mean ± standard error of mean (S.E.M.); unpaired two-tailed t-test at a 95% confidence interval)
c) Representative H&E images of tumor-bearing lungs of WT, isotype antibody (n = 5), KO, isotype antibody (n = 5), WT that received the MIC-A stabilizing antibody (αMICA) (n = 5), KO that received the αMICA (n = 6), and KO that received both αMICA and an NK cell-depleting antibody (n = 5) (left). Quantification of the tumor area as a percent of the total area of the lung cross-section from tumor-bearing lungs of these mice is shown (right). (mean ± standard error of mean (S.E.M.); unpaired two-tailed t-test at a 95% confidence interval)
d) Graphical summary of the regulation of NK cells by TREM2+ mo-macs in the tumor microenvironment.

