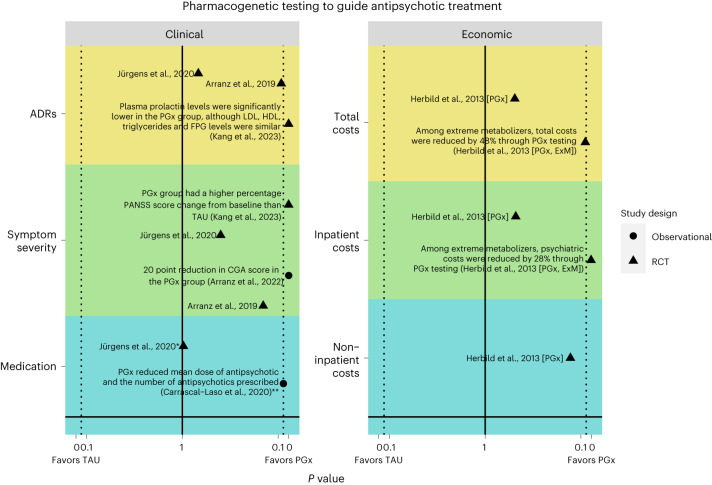
Fig. 2. Visualization of the literature with key results for the clinical and economic outcomes.
Primary studies that reported a P value are plotted to depict the direction of effect for each outcome (whether they favor pharmacogenetics or TAU or whether there is no significant difference between the two treatment arms). The y axis lists the outcomes grouped by themes. The x axis plots the P value reported in the primary study as a measure of the strength of the evidence. The solid line marks a P value of 1, and the dotted line marks the significance threshold of P < 0.05. The study design (RCT or observational) and sample size are displayed. Herbild et al.28conducted a main analysis comparing PGx versus TAU (denoted [PGx]) and a subanalysis comparing extreme metabolizers in the PGx group (denoted [PGx, ExM]) to TAU. For non-inpatient costs (primary care costs) there was no subgroup analysis for the extreme metabolizers. Studies that did not report P values were excluded from the visualization. FPG, fasting plasma glucose; PGx, pharmacogenetics; RCT, randomized control trial. *Exact P value not indicated but specified that it is >0.05; **exact P value not indicated but specified that it is <0.05.

