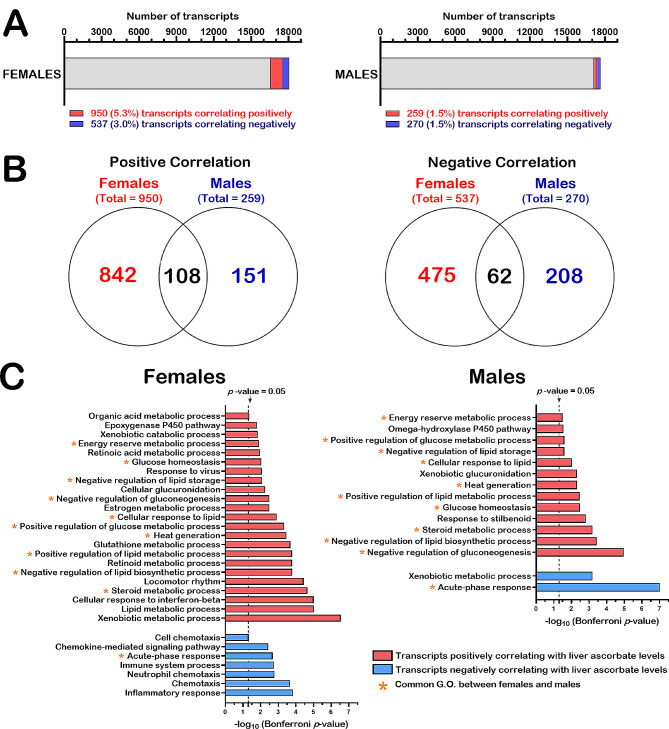
Fig. 3.
Liver transcripts correlating with hepatic ascorbate levels in females and males. (A) Graphs indicating the number and percentage of transcripts that correlated positively or negatively with hepatic ascorbate levels among the total number of identified and quantified transcripts in females (18,050 transcripts) and males (17,661 transcripts). (B) Venn diagrams showing the number of transcripts that correlated positively and negatively with liver ascorbate levels and the number of transcripts that were common among females and males. (C) Graphs showing biological processes with transcripts that significantly correlated positively or negatively with liver ascorbate levels in females and males. Asterisks indicate the processes that are common in both females and males

