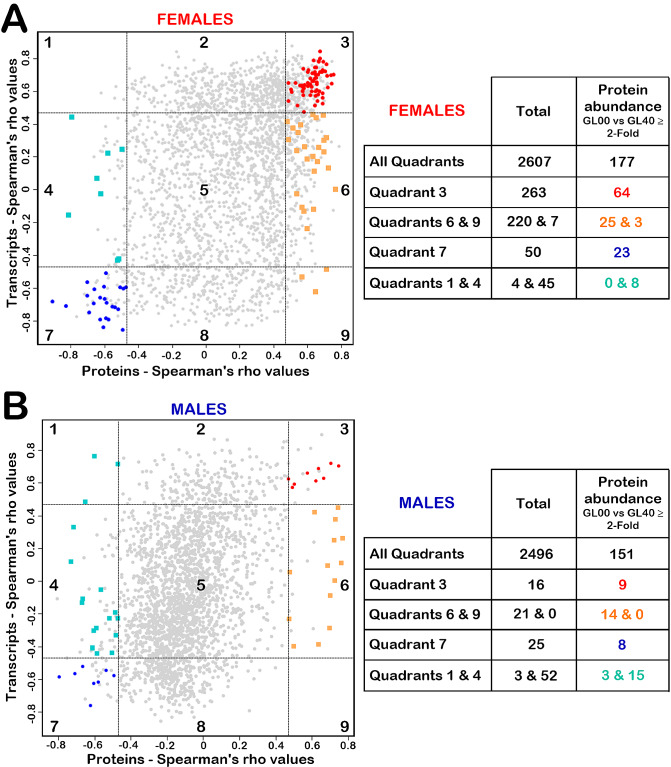
Fig. 5.
Nine-quadrant diagrams of transcriptome and proteome Spearman correlation analysis in females (A) or males (B). The scatter plots, on the left panels, are divided into nine quadrants with the x and y axes representing the Spearman rho values for the proteins and the transcripts, respectively, using the significance thresholds (dashed lines on the x and y axes at the rho values equal to 0.46876 or -0.46876). The quadrant numbers are included in each rectangle in black on the scatter plots. Genes that exhibited at least a two-fold abundance difference, at their protein level, between GL00 and GL40, were represented by red circles in quadrant 3, blue circles in quadrant 7, turquoise squares in quadrants 1 and 4, and orange squares in quadrants 6 and 9. The number of proteins in each quadrant are shown in the tables on the right of the scatter plots for the females (A) and males (B)

