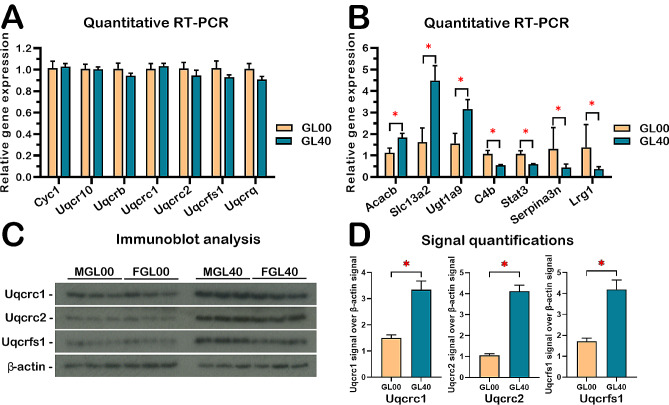
Fig. 6.
Quantitative RT-PCR analyses and immunoblotting in ascorbate-deficient Gulo-/- mice livers compared to Gulo−/− mice treated with 0.4% ascorbate in drinking water since weaning. (A) Graph showing the expression of seven mRNAs coding for mitochondrial complex III complex proteins by quantitative RT-PCR in the liver of both males and females. GL00 = ascorbate-deficient Gulo−/− mice; GL40 = Gulo−/− mice treated with 0.4% ascorbate since weaning (N = 4 for each RT-PCR experiment). (B) Graphs of quantitative RT-PCR analyses of the indicated gene transcripts correlating positively or negatively with liver ascorbate levels in Gulo−/− mice treated with 0.4% ascorbate in drinking water since weaning compared to ascorbate-deficient Gulo−/− mice (N = 4 for each RT-PCR experiment) (*p-value < 0.05; Welch’s t-test). (C) Analyses of three different proteins from the mitochondrial complex III of the electron transfer chain complexes by western blots on whole liver lysates for Gulo−/− males and females (N = 3 females (F) and 3 males (M) for each cohort). (D) Signal quantification of Uqcrc1, Uqcrc2, and Uqcrfs1 proteins over ß-actin signal from the immunoblot analysis in C (N = 6 animals in total per groups)

