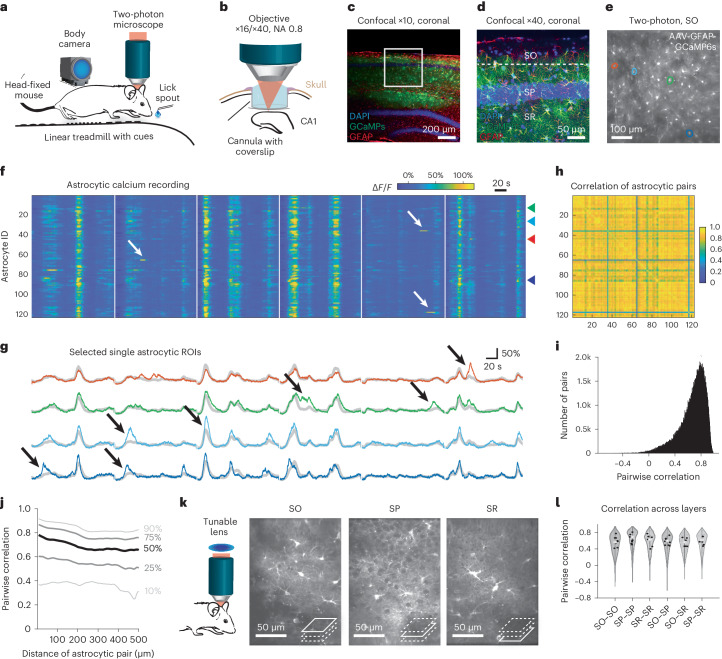
Fig. 1. Hippocampal astrocytes in CA1 exhibit global and local events during behavior.
a, Schematic representation of in vivo recording setup. b, Hippocampal two-photon imaging through an implanted cannula. c,d, Histology of virus-induced GCaMP6s expression in hippocampal astrocytes (green) together with GFAP-antibody staining (red) and nuclear stain (blue). Overview (c) and zoom-in (d). See also Extended Data Fig. 1 and Supplementary Fig. 2. e, Average fluorescence two-photon image of astrocytes in the SO expressing GCaMP6s. f, Temporal calcium dynamics of active astrocyte ROIs from the FOV shown in e. White arrows indicate isolated local calcium events. Recording segments (140 s) are indicated through vertical white spacers. g, Example of four astrocytic ROIs (highlighted with matching colors in e and in f with arrowheads), indicating local modulation of global events for astrocytic ROIs (black arrows). Global mean across the FOV is overlaid as gray traces. h, Activity correlation between the astrocytic pairs from f, same ordering of ROIs. i, Distribution of activity correlations between astrocytic active region pairs across the entire population (204,686 astrocyte ROI pairs from 41 experimental sessions and six animals; 0.72 ± 0.20, median ± s.d.). j, Distance dependence of pairwise correlations, with the median (50%) and other percentile lines of the distribution shown. k, Using a tunable lens to quasi-simultaneously image multiple CA1 layers. l, Pairwise correlation across simultaneously imaged astrocyte pairs associated with specific CA1 layers (distributions in the violin plots), and medians across astrocyte pairs for each session (black dots). No significant differences (P > 0.2 for all comparisons) across conditions for session-based testing (n = 8 sessions from two animals).

