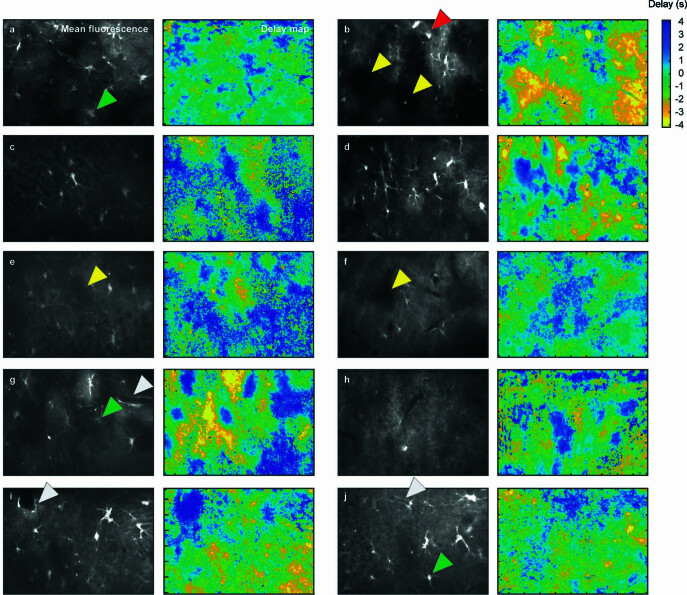
Extended Data Fig. 4. Examples of delay maps.
Maps of delays of astrocytic signal with respect to the global mean fluorescence, computed as described in Fig. 5 and Supplementary Fig. 9. Each delay map represents an entire imaging FOV (40× objective, 200 µm side length in x direction). Yellow arrowheads highlight regions that are devoid of somata and thick processes, therefore mostly containing fine gliapil processes. Green arrowheads highlight astrocytic somata that are, unlike other soma examples shown in Fig. 5h and Supplementary Fig. 9, not activated in a delayed manner with respect to the global mean activation. White arrowheads highlight astrocyte processes around blood vessels, exhibiting a delayed activation with respect to the global mean activity. The red arrowhead highlights an ectopically labeled interneuron; such interneuron pixels were blanked for the analysis in Fig. 6.

