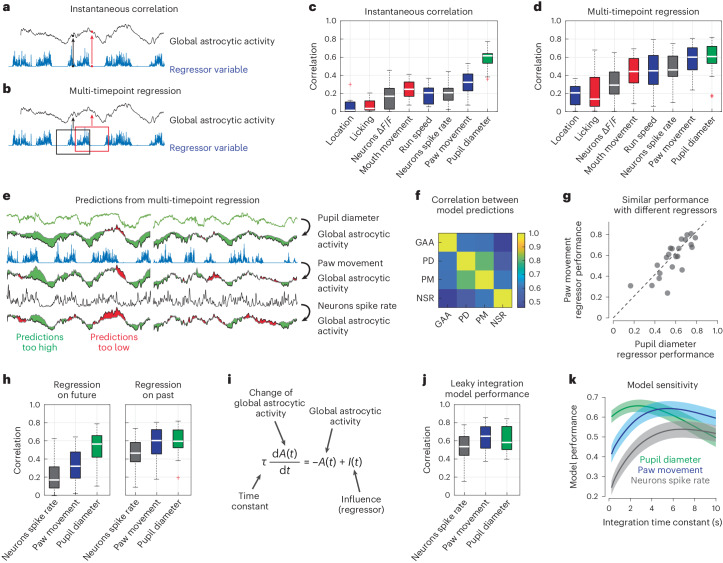
Fig. 3. Global astrocytic activity can be well explained by past behavior, mean neuronal spike rate or pupil diameter.
a, Schematic illustration of instantaneous correlation. A single timepoint is used to predict a simultaneous astrocytic timepoint. b, Schematic illustration of multi-timepoint regression. A range of data points in a window is used to predict a single timepoint of astrocytic activity. c,d, Performance of various regressors when using instantaneous correlation (c) or multi-timepoint analysis (d) to predict astrocytic activity (n = 22 imaging sessions from four animals). Box plot properties are defined as described in Methods. e, Example cross-validated predictions from the three best regressors (pupil diameter, paw movement and mean neuronal spike rate). Green areas indicate when predicted activity is too high, and red areas indicate when it is too low. f, Average correlation between global astrocytic activity and the activity predicted by the three regressors (GAA, global astrocytic activity; PD, pupil diameter; PM, paw movement; NSR, neurons spike rate). g, Example of performance for two different regressors (pupil diameter and paw movement) across sessions (correlation r = 0.79). See also Supplementary Fig. 5. h, Multi-timepoint regression, but using only either future or past timepoints (n = 22 sessions). i, Leaky integration differential equation to model global astrocytic activity A(t) as a function of regressor input I(t), dependent on the integration time constant τ. j, Performance using the leaky integration differential equation (n = 22 sessions from four animals). k, Model sensitivity with respect to τ (mean ± bootstrapped 90% confidence interval of the mean, determined from 22 imaging sessions). For box plots, the median is indicated by the central line; 25th and 75th percentiles are indicated by the box and maximum/minimum values excluding outliers are indicated by the whiskers.

