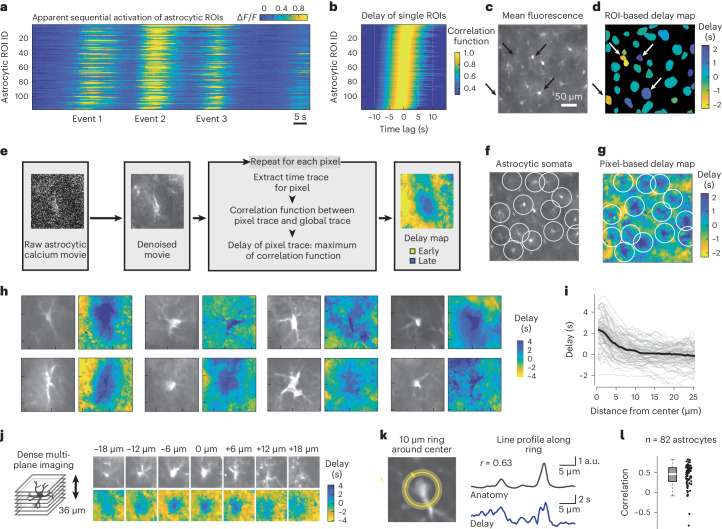
Fig. 5. Propagation of astrocytic activity from distal to somatic compartments.
a, Calcium signals of hippocampal astrocytes during behavior form an apparent sequence. Astrocytic ROIs are sorted by the delay of each signal with respect to the global mean. b, Correlation functions of astrocytic ROIs, same sorting as in a. The excerpt in a is only a fraction of the activity pattern used for the analysis. c, Excerpt from the mean fluorescence of the FOV from a and b. d, Delays extracted as maxima in b, mapped onto astrocytic ROIs. Rightward-pointing and leftward-pointing arrows highlight ROIs with negative (undefined anatomical structure) and positive delay (cell bodies), respectively. e. Processing pipeline for pixel-wise delay maps (Supplementary Fig. 9). f, Same map as in c, with white circles highlighting identified astrocytes. g, Pixel-based delay map corresponding (f). Somata (centers of circles) are activated with a positive delay and gliapil with a negative delay. h, Zoom-in to delay maps around identified astrocytes. The side length of each zoom-in is ~55 µm. See Extended Data Figs. 4 and 5 for more examples. i, Radial distribution of delay versus distance from astrocytic soma center (gray lines for individual astrocytes; 82 astrocytes from 11 sessions in four mice). j, Example of dense multiplane calcium imaging, FOV excerpt focused on a single astrocyte. The 3D delay map (computed from denoised data) exhibits the longest delay at the soma. The side length of each tile is ~55 µm. See Extended Data Fig. 6 for more examples. k, A 2.5-µm-thick ring with a diameter of 10 µm defines a circular line plot that covers both large (bright anatomy) as well as small (dark) processes. Delay and fluorescence (anatomy) along the circular line plot are visibly correlated. l, Distribution of Pearson correlation values as in k across 82 astrocytes (0.46 ± 0.29, median ± s.d.). For box plots, the median is indicated by the central line; 25th and 75th percentiles are indicated by the box and maximum/minimum values excluding outliers are indicated by the whiskers.

