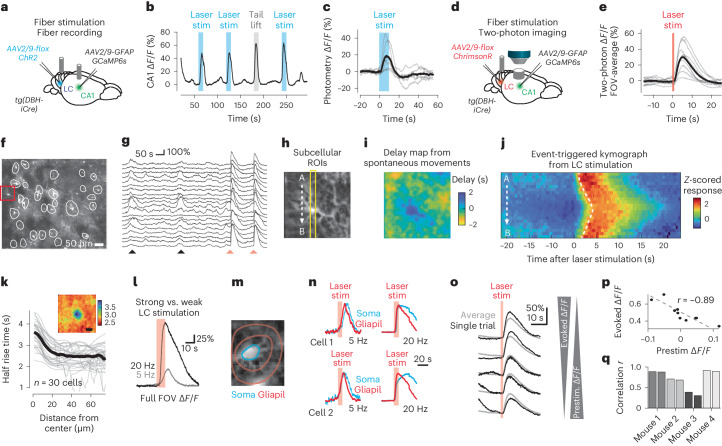
Fig. 7. Optogenetic activation of LC triggers centripetal propagation of calcium signals in astrocytes.
a, Setup for fiber-optic recording of calcium signals in hippocampal astrocytes together with optogenetic LC stimulation. b, Example of fiber photometry during LC stimulation (blue) or during tail lift (gray). c, Average of opto-evoked ∆F/F traces (gray, individual mice). d, Setup for two-photon calcium imaging of hippocampal astrocytes together with optogenetic LC stimulation. e, Average of LC-evoked, FOV-averaged ∆F/F traces (n = 9 sessions across four mice). f, Example FOV in the SO with manually labeled ROIs. g, ∆F/F traces corresponding to f with astrocytic activity related to movement (black arrowheads) and optogenetic stimulation (red arrowheads). h, Zoom-in to single astrocyte (square in f). i, Delay map for the astrocyte in h, computed from denoised imaging data and excluding optogenetic stimulation periods. j, Optogenetic stimulation-triggered kymograph along the A→B line in h, showing centripetal propagation in a single astrocyte. Average across ten stimulations across 18 min, computed from raw data. Dashed line indicates half-rise time. k, Radial plot of the half-rise time of LC-evoked responses as a function of distance from the astrocytic center. Inset, underlying 2D map of half-rise times (scalebar, 20 µm). Averaged across 30 astrocytes with identifiable soma in the imaging plane from four sessions in four mice. l, Example of opto-evoked average responses for weak (gray) and strong (black) stimulation. m, Manually defined ROIs to separate somatic and gliapil calcium signals. n, Examples of persistent activation of soma (blue) but not gliapil (red) for strong but not weaker stimulation in individual astrocytes. Extended Data Fig. 9 for more examples. o, Amplitudes of LC-evoked responses decrease for higher prestimulus calcium levels. Example of full-FOV responses for a single imaging session. p, Prestimulus ∆F/F and LC-evoked responses are negatively correlated (quantified from data partially shown in o). q, The absolute value of the correlation from p plotted across mice (two sessions per mouse; statistically higher than for shuffled data with P = 2 × 10⁻⁶, P = 0.0007, P = 0.0007 and P = 0.047 for the four mice; shuffled data were obtained by permuting prestimulus ∆F/F values; P values from 10k shuffles).

