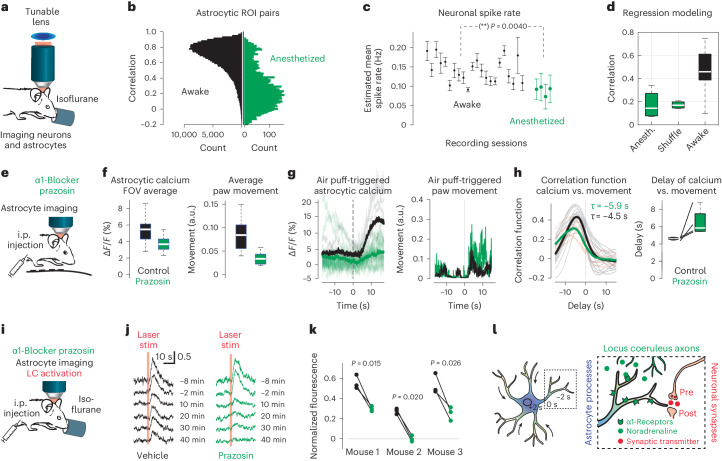
Fig. 8. Perturbation of LC-driven noradrenergic signaling impedes global calcium signals and centripetal propagation.
a, Simultaneous imaging of astrocytes and neurons during isoflurane-induced anesthesia, a state of reduced noradrenergic signals. b, Pairwise correlation between astrocytes during awake (corresponds to Fig. 1i) and anesthetized conditions. c, Estimated neuronal spike rate (mean ± s.d. across neurons) is slightly decreased for anesthesia compared to wakefulness (Pboot < 10−4, hierarchical bootstrapping test; n = 22 sessions for wakefulness, n = 4 for anesthetized and shuffle). **P = 0.0040. d, Global astrocytic activity is well predicted by neuronal activity during wakefulness but not during anesthesia (data from c). e, Two-photon calcium imaging during behavior after i.p. injection of the α1-blocker prazosin. f, Prazosin injection reduced average global astrocytic calcium (left; computed with median as F0 baseline) but also reduced spontaneous movement (right). Nineteen versus eight imaging sessions for control versus prazosin condition in n = 4 mice. g, Reduced stimulus-evoked calcium signals after prazosin injection (left) despite increased stimulus-triggered movement (right; 17 air puffs for prazosin, six for control condition). h, Correlation functions showing that astrocytic activity is more delayed with respect to movement after prazosin injection than after control (left). For paired experiments (animal on first day with saline injection, second day with prazosin condition), delays are increased for each animal (right; n = 4 animals; see Supplementary Fig. 13 for per-animal data). i, Injection (i.p.) of the α1-blocker prazosin with simultaneous astrocytic two-photon imaging and optogenetic LC stimulation during anesthesia. j, Example for reduction of opto-evoked calcium signals after injection. The reduction is stronger for prazosin (right) than for saline condition (left). k, Reduction of opto-evoked calcium response after prazosin application across three mice. ΔF/F responses normalized to preinjection levels. Data point triples are taken from timepoints 20, 30 and 40 min after injection; t test are applied for these pairs of triples. l, Schematic working model of conditional centripetal propagation in astrocytes, controlled by noradrenergic LC signals. For box plots, the median is indicated by the central line; 25th and 75th percentiles are indicated by the box and maximum/minimum values excluding outliers are indicated by the whiskers.

