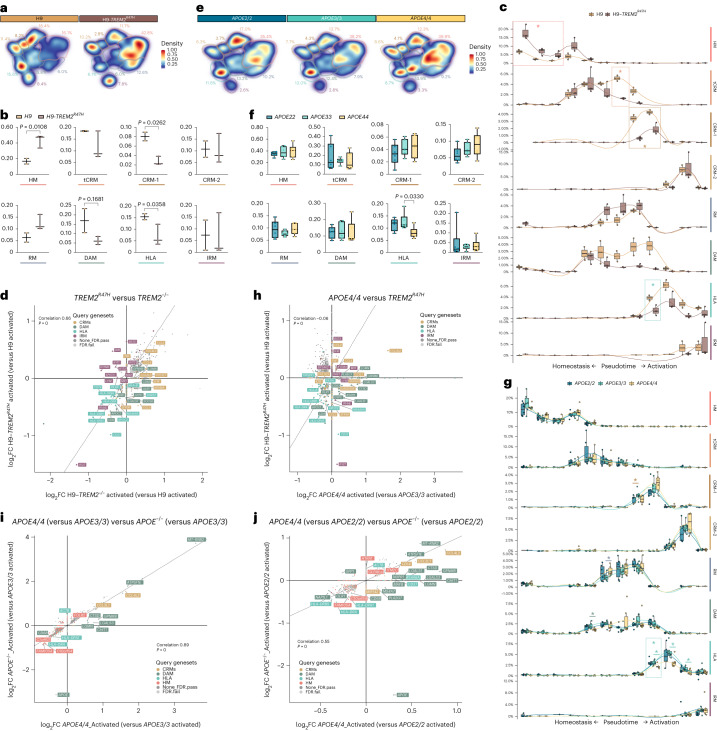
Fig. 7. AD genetic risk modifies the response of human microglia to Aβ pathology.
a,e, Density plots displaying the average distribution of human H9-WT (n = 2) and H9-TREM2R47H (n = 3) (a), and APOE2/2 (n = 6), APOE3/3 (n = 6) and APO4/4 (n = 6) human microglia (e) transplanted in AppNL-G-F mice. b,f, Distribution and percentage of cells across all identified clusters for H9-WT (n = 2) and H9-TREM2R47H (n = 3) (b), and APOE2/2 (n = 6), APOE3/3 (n = 6) and APO4/4 (n = 6) (f). Dots represent single mice. c,g, Phenotypic trajectory followed by H9-WT (n = 2) and H9-TREM2R47H (n = 3) (c), and APOE2/2 (n = 6), APOE3/3 (n = 6) and APO4/4 (n = 6) (g) human microglia obtained by an unbiased pseudotime ordering with Monocle 3. Proportion of cells (y axis) over the binned pseudotime trajectory (x axis), colored by genotypes shown in a. Dots represent single mice (*P < 0.05). d,h, Correlation of the logFC in TREM2R47H versus H9-WT (y axis) and H9-TREM2−/− versus H9-WT (x axis) (d), and TREM2R47H versus H9-WT (y axis) and APOE4/4 versus APOE3/3 (x axis) (h) microglia transplanted in AppNL-G-F mice (Pearson’s correlation, R = 0.17, differentially expressed genes were adjusted using Bonferroni correction and colored as in Fig. 1b). i,j, Comparison of transcriptomic profiles of APOE4/4 (versus APOE3/3) versus APOE−/− (versus APOE3/3) (i), and APOE4/4 (versus APOE2/2) versus APOE−/− (versus APOE2/2) (j) microglia transplanted in AppNL-G-F mice (Pearson’s correlation, differentially expressed genes were adjusted using Bonferroni correction and colored according to clusters in Fig. 1b). Box plots in b,c,f,g are limited by lower and upper quartiles and midline indicates median; whiskers show minimum to maximum values (b,f) or extend from the box to the smallest or largest value no further than 1.5 × interquartile range (c,g). Unpaired t-test with Welch’s correction, two-tailed, alpha = 0.05, significance was set as P < 0.05 (b,c); or one-way ANOVA with Tukey’s multiple comparisons as post hoc test, alpha = 0.05, significance was set as P-adjusted value < 0.05 (f,g). In d,h,i, ‘activated’ indicates that differential expression was performed comparing reactive cell states, excluding homeostatic or transitioning clusters.

