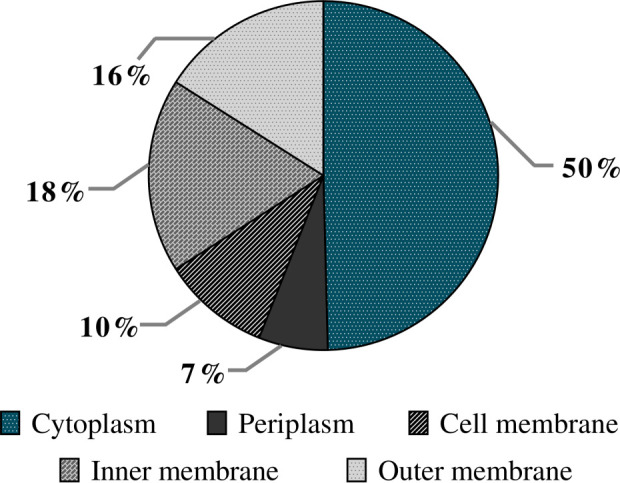
Figure 6.

Predicted localization of EV proteins from the native Escherichia coli M19736. The pie diagram represents the localization of different proteins found inside or on the surface of EVs. The results are represented as the percentage of proteins found in different localizations from the native E. coli M19736.
