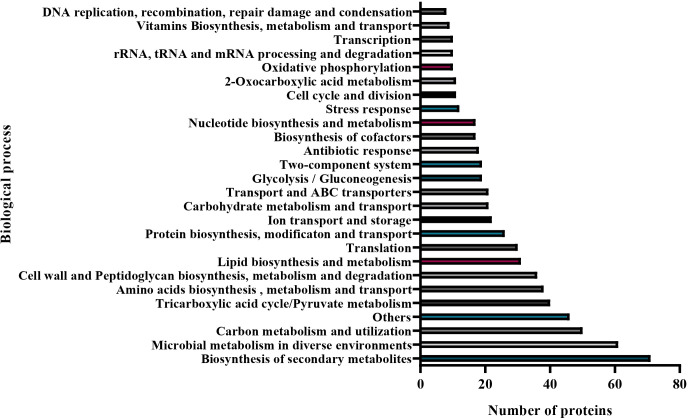
Figure 7.
Biological processes associated with EV proteins from the native E. coli M19736. Bar graphs categorizing the proteins with 28 differential biological functions, with distributions in the number of proteins. The functions of EV proteins are graphed with the most abundant function at the bottom and the least abundant function at the top.

