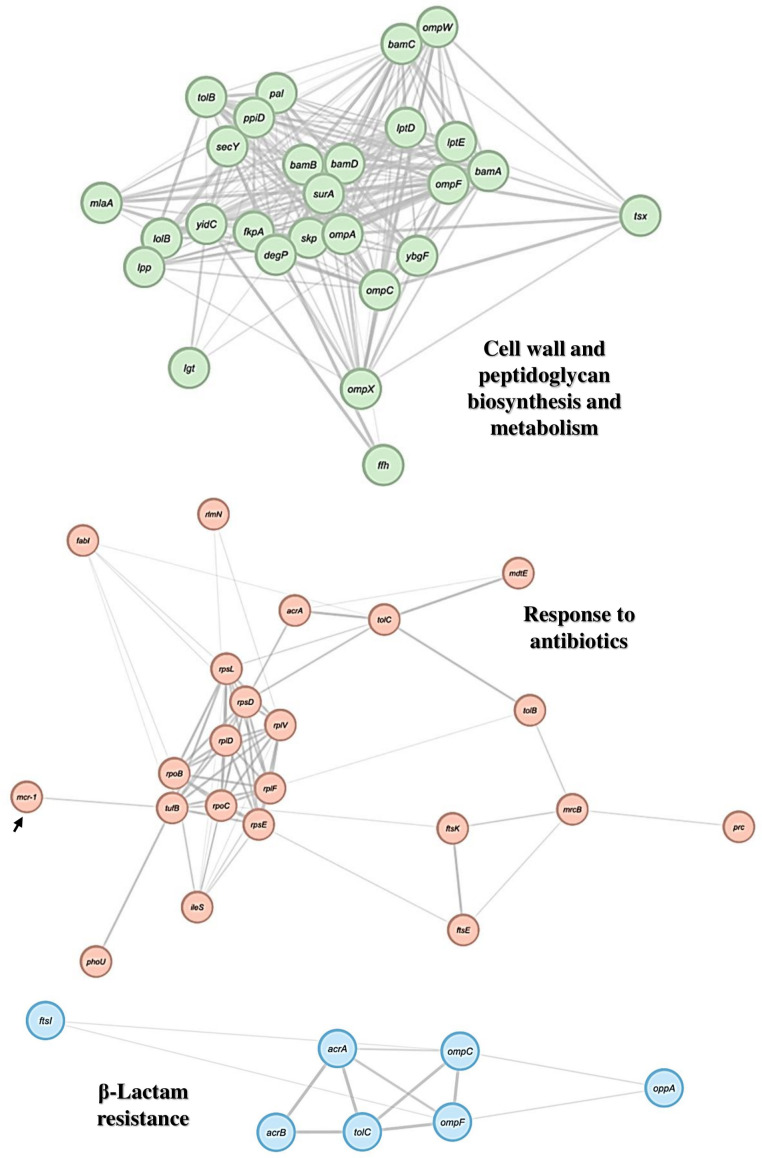
Figure 8.
PPI network of proteins of interest found in EV from the native E. coli M19736. Gene Ontology and KEEG enrichment analysis of genes/proteins from the proteomes of EVs derived from the native E. coli M19736 using the STRING software and visualization using the Cytoscape software. The node colors represent the biological process or cellular functions of the genes/proteins of interest according to significant associations of related Gene Ontology and KEEG terms. The arrow points to the MCR-1 protein.

