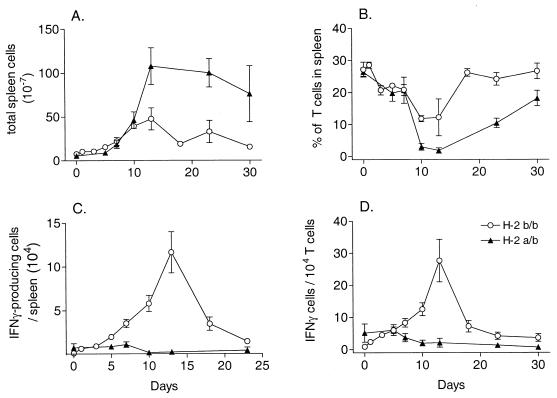
FIG. 2.
Kinetics of IFN-γ-producing cells in H-2b/b and H-2a/b mice after FV infection. All results are the means ± the standard errors of the means for three to five mice per group. (A) Total number of spleen cells in spleens of H-2b/b and H-2a/b mice at various time points after infection with 1,500 SFFU of FV. (B) Percentage of T cells in each spleen. Spleen cells were analyzed by flow cytometry for the percentage of CD3+ T cells (fluorescein isothiocyanate-labeled 145-2C11 MAb; Pharmingen) in each spleen. (C) Number of FV-specific IFN-γ-producing cells per spleen as determined by ELISPOT assay. Spleen cells from H-2b/b or H-2a/b mice were serially diluted, activated with FV-infected stimulator cells, and analyzed for the number of IFN-γ-producing cells using an IFN-γ-specific ELISPOT assay. Background dots from wells with stimulator and feeder cells only were subtracted to derive the total number of spots for each well. (D) Ratio of IFN-γ-producing cells to T cells in spleens. The number of IFN-γ-producing cells in each spleen was divided by the actual number of T cells in each spleen to account for the changes in the percentage of T cells.

