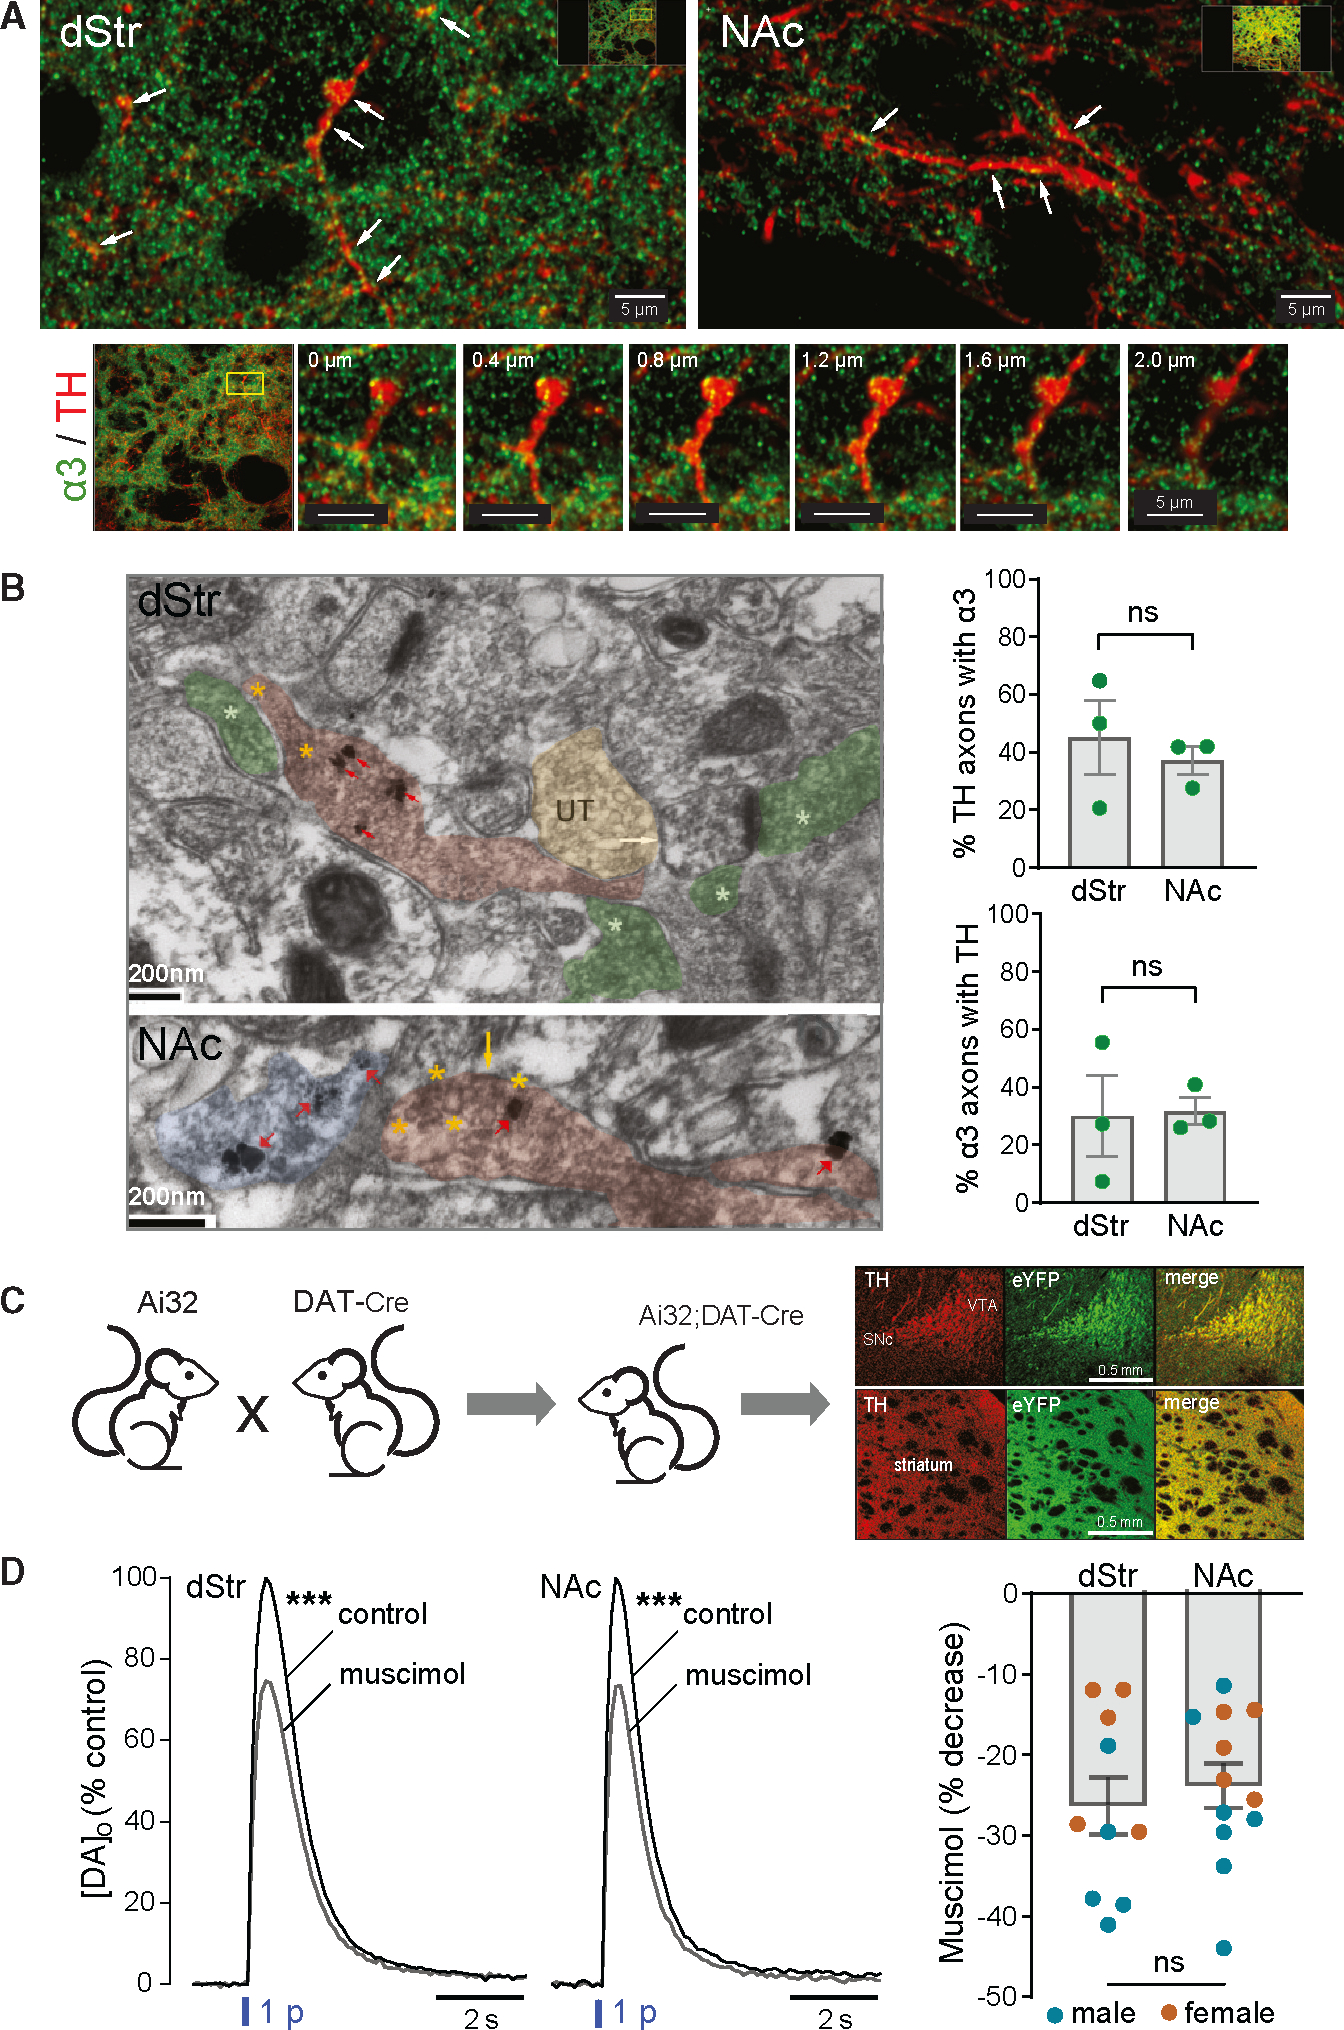
Figure 1. Anatomical and functional localization of GABAAR subunits on DA axons.

(A) Top: immunofluorescent images obtained with confocal microscopy showing co-localization of α3-GABAAR subunits with TH-labeled DA axons in dStr (left) and NAc core (right). White arrows indicate where co-localization is seen. Images are from a single plane of a z stack captured with a 60× Nikon oil-immersion objective (1.4 NA). Scale bar, 5 μm. Bottom: expanded views of a region of interest in the dStr at different levels in the z stack, demonstrating localization of α3-puncta in DA axonal profiles. Scale bar, 5 μm.
(B) Left: electron micrographs showing α3-GABAAR subunits co-localized with TH-labeled DA axons in dStr and NAc core. Top: TH axons in dStr were identified by the presence of more than one SIG particle within an axonal profile packed with vesicles (red arrows), while presence of α3-GABAAR subunits was identified by electron-dense diffuse DAB-horseradish peroxidase (HRP) labeling of vesicular and plasma membranes (asterisks). α3 subunits within TH axons (red overlay) are highlighted by yellow asterisks, whereas α3-GABAAR subunits in non-TH axons (green overlay) are highlighted by white asterisks; UT marks an unlabeled axon terminal (yellow overlay). The white arrow points to the plasma membrane of a non-TH profile, identifiable as a dendritic spine receiving excitatory synaptic input from a non-TH axon terminal (rightmost asterisk), presumably glutamatergic and α3 positive. Scale bar, 200 nm. Bottom: TH axons and α3-GABAAR subunits in NAc core were identified as above and shown at higher magnification to highlight immunolabeling of the plasma membrane of a dually labeled axon (yellow arrow) and of vesicle membranes (encircled by yellow asterisks). Blue overlay shows a TH axon without α3. Scale bar, 200 nm. Right: average data, quantifying the percentage of TH axons expressing α3 (upper graph) and α3 axons expressing TH (lower graph) in dStr and NAc (n = 3 mice; mean ± SEM; ns is not signficant).
(C) Cartoon showing generation of Ai32;DAT-Cre mice with genetic ChR2 expression in DAT-containing neurons and images of fixed coronal brain sections confirming selective fluorescent labeling of eYFP-ChR2 expression in midbrain DA (TH) soma and striatal axons. Scale bars, 0.5 mm.
(D) Right: average optically evoked single-pulse (1 p) [DA]o transients recorded in dStr and NAc in the absence or presence of the GABAAR agonist muscimol (Mus, 10 μM); error bars omitted for clarity. Muscimol significantly decreased 1 p-evoked [DA]o in both the dStr (n = 10 mice) and NAc (n = 12 from 11 mice). ***p < 0.01 versus respective control (ratio paired t test). Left: graph showing individual data (mean ± SEM) for the percentage decrease of peak [DA]o by muscimol in males (blue circles) plus females (orange circles) in dStr versus NAc (p > 0.05, unpaired t test; n is not significant).
