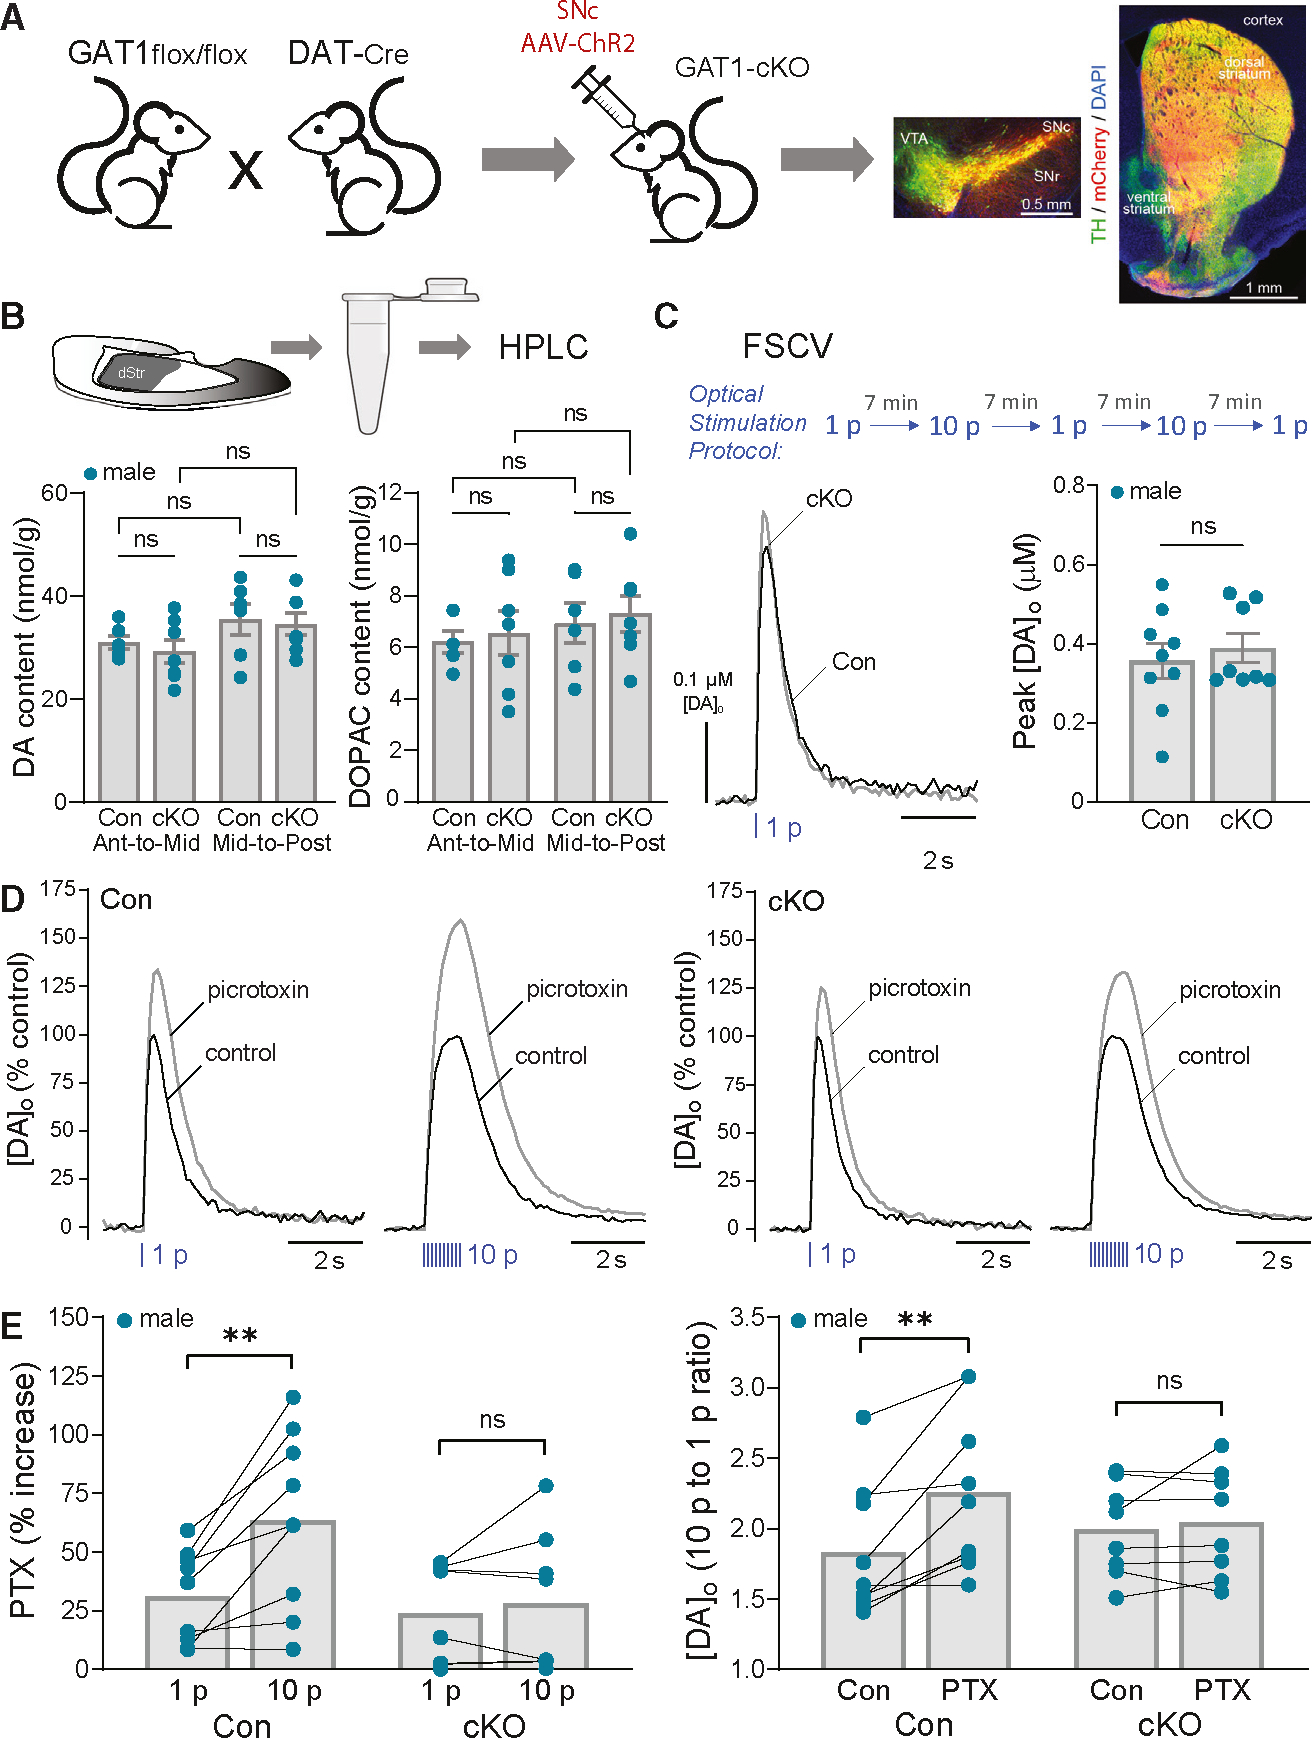
Figure 5. Autoregulation of DA release by co-released GABA is lost with GAT1 deletion from DA axons.

(A) Cartoon showing generation of GAT1;DAT-Cre cKO mice (GAT1-cKO) with SNc AAV-ChR2-mCherry injection and images of fixed coronal brain sections showing fluorescent labeling of ChR2 expression (mCherry) in midbrain DA (TH) somata and striatal axons; DAPI was used to label all cells. Scale bar, 0.5 mm.
(B) Tissue collection of dStr for HPLC-EC analysis. Tissue content of DA and the DA metabolite DOPAC did not differ in anterior-to-mid or mid-to-posterior dStr (p > 0.05, two-way ANOVA) between GAT1;DAT-Cre cKOs (n = 7 samples for each subregion from 7 mice) versus DAT-Cre-Het controls (n = 6 samples for each subregion from 6 mice).
(C) Same-site recording with alternating single-pulse (1 p) and multiple-pulse (10 p at 10 Hz) optical stimulation. Average 1 p evoked [DA]o transients recorded in control and GAT1-cKO mice under control conditions; error bars omitted for clarity. Average DA release for 1 p did not differ significantly between genotypes (unpaired t test, n = 8 GAT1-cKO mice versus n = 9 control mice).
(D) Average normalized 1 p and 10 p optically evoked [DA]o transients in control and GAT1-cKO mice in the absence and presence of PTX (100 μM).
(E) PTX had a significantly greater effect of increasing peak [DA]o evoked by 10 p versus 1 p in control mice (paired t test, n = 9) but not in GAT1-cKO mice (paired t test, n = 8). Consequently, the enhanced ratio of phasic (10 p) totonic (1 p) DA release in control mice was lost in cKOs.
**p < 0.01 versus respective 1 p or control. Data are mean ± SEM; ns is not significant.
