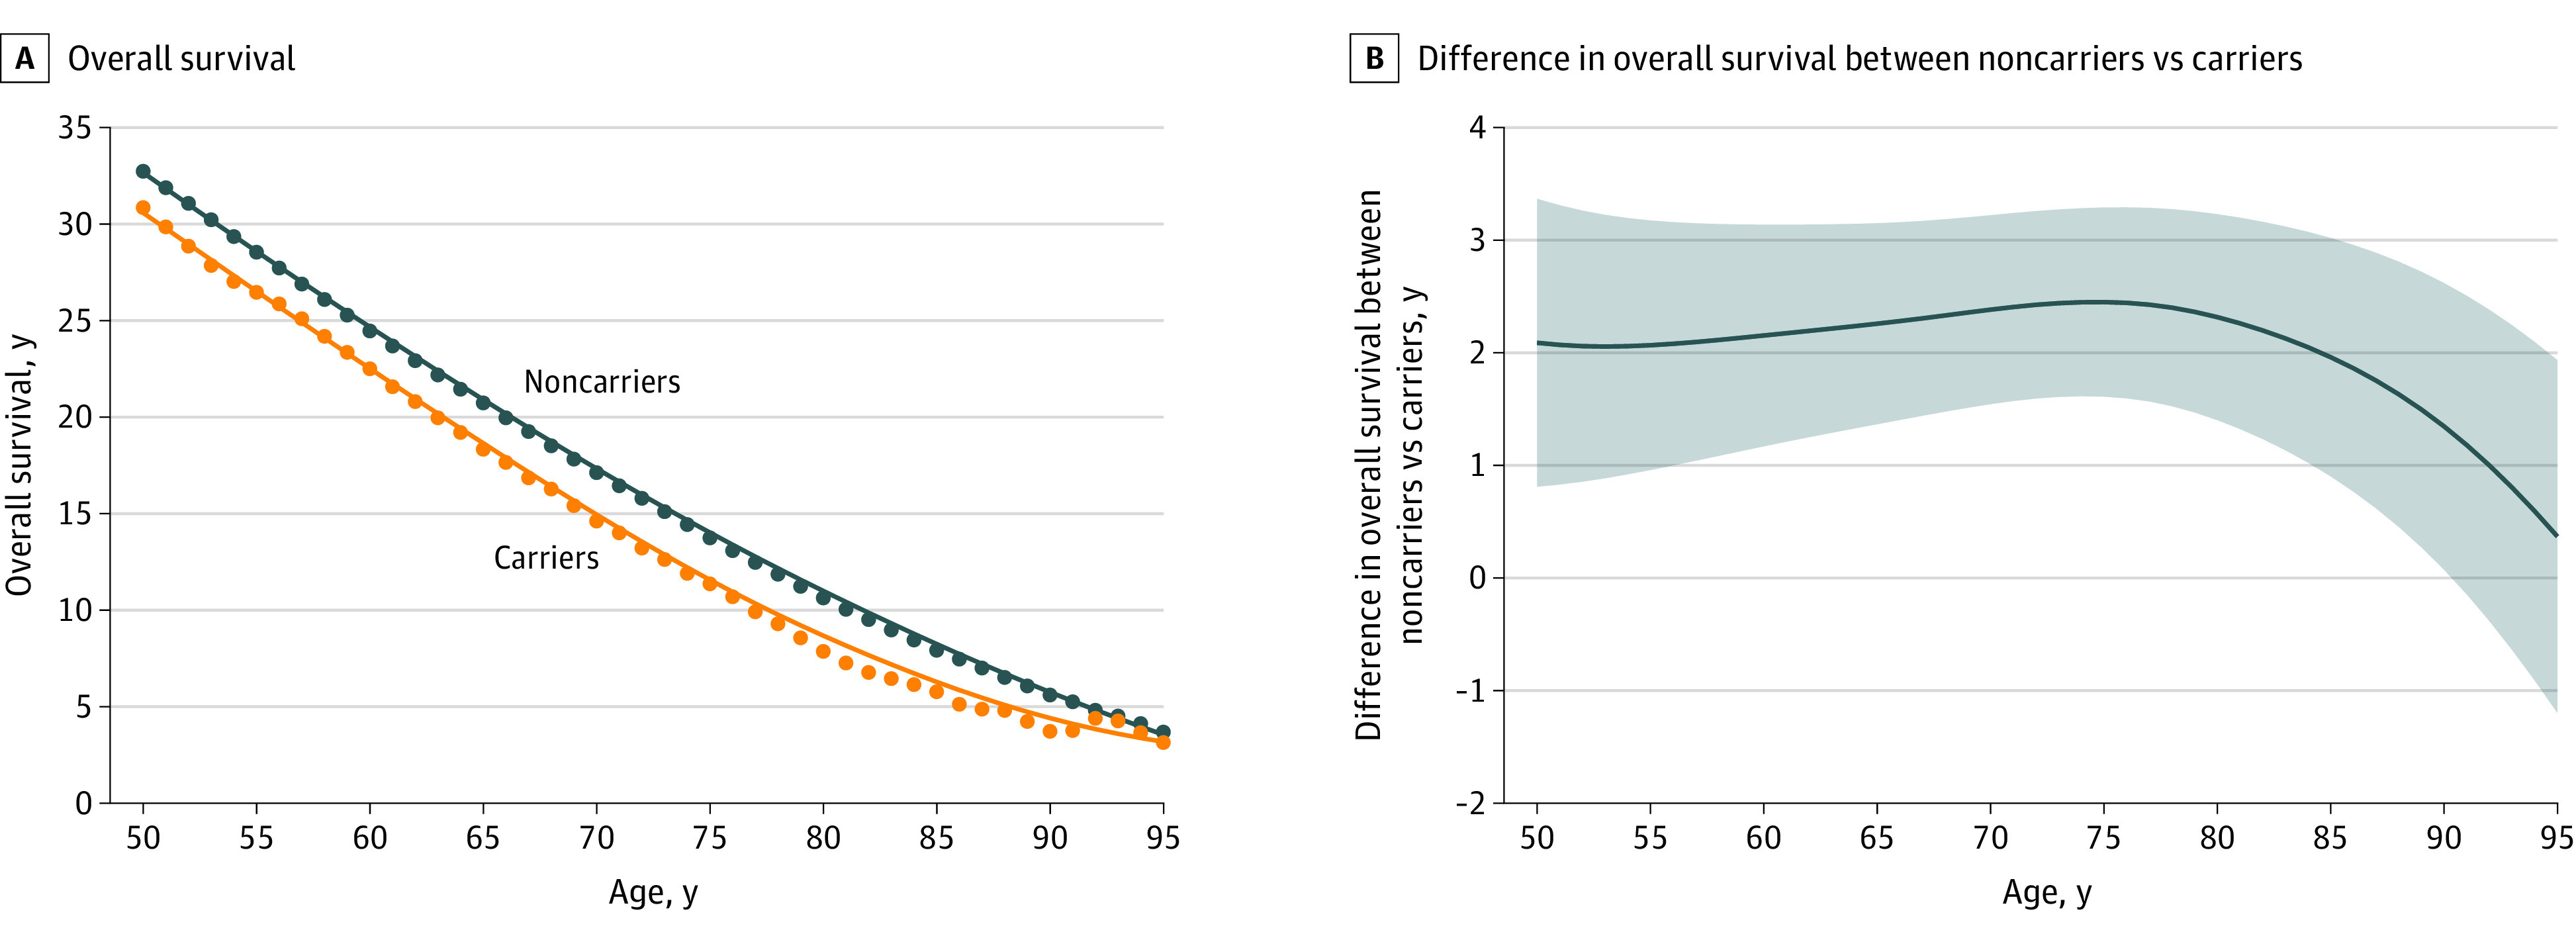
Figure 3. Effect of V142I on Overall Survival of Carriers Compared With Noncarriers.

A, Estimated mean overall survival in carriers and noncarriers for every year between ages 50 and 95 years. B, The difference in mean years lost among carriers compared with noncarriers shown with the smoothed estimate (blue line), and 95% CI of the smoothed estimate (shaded area) after application of a locally weighted scatterplot smoothing procedure.
