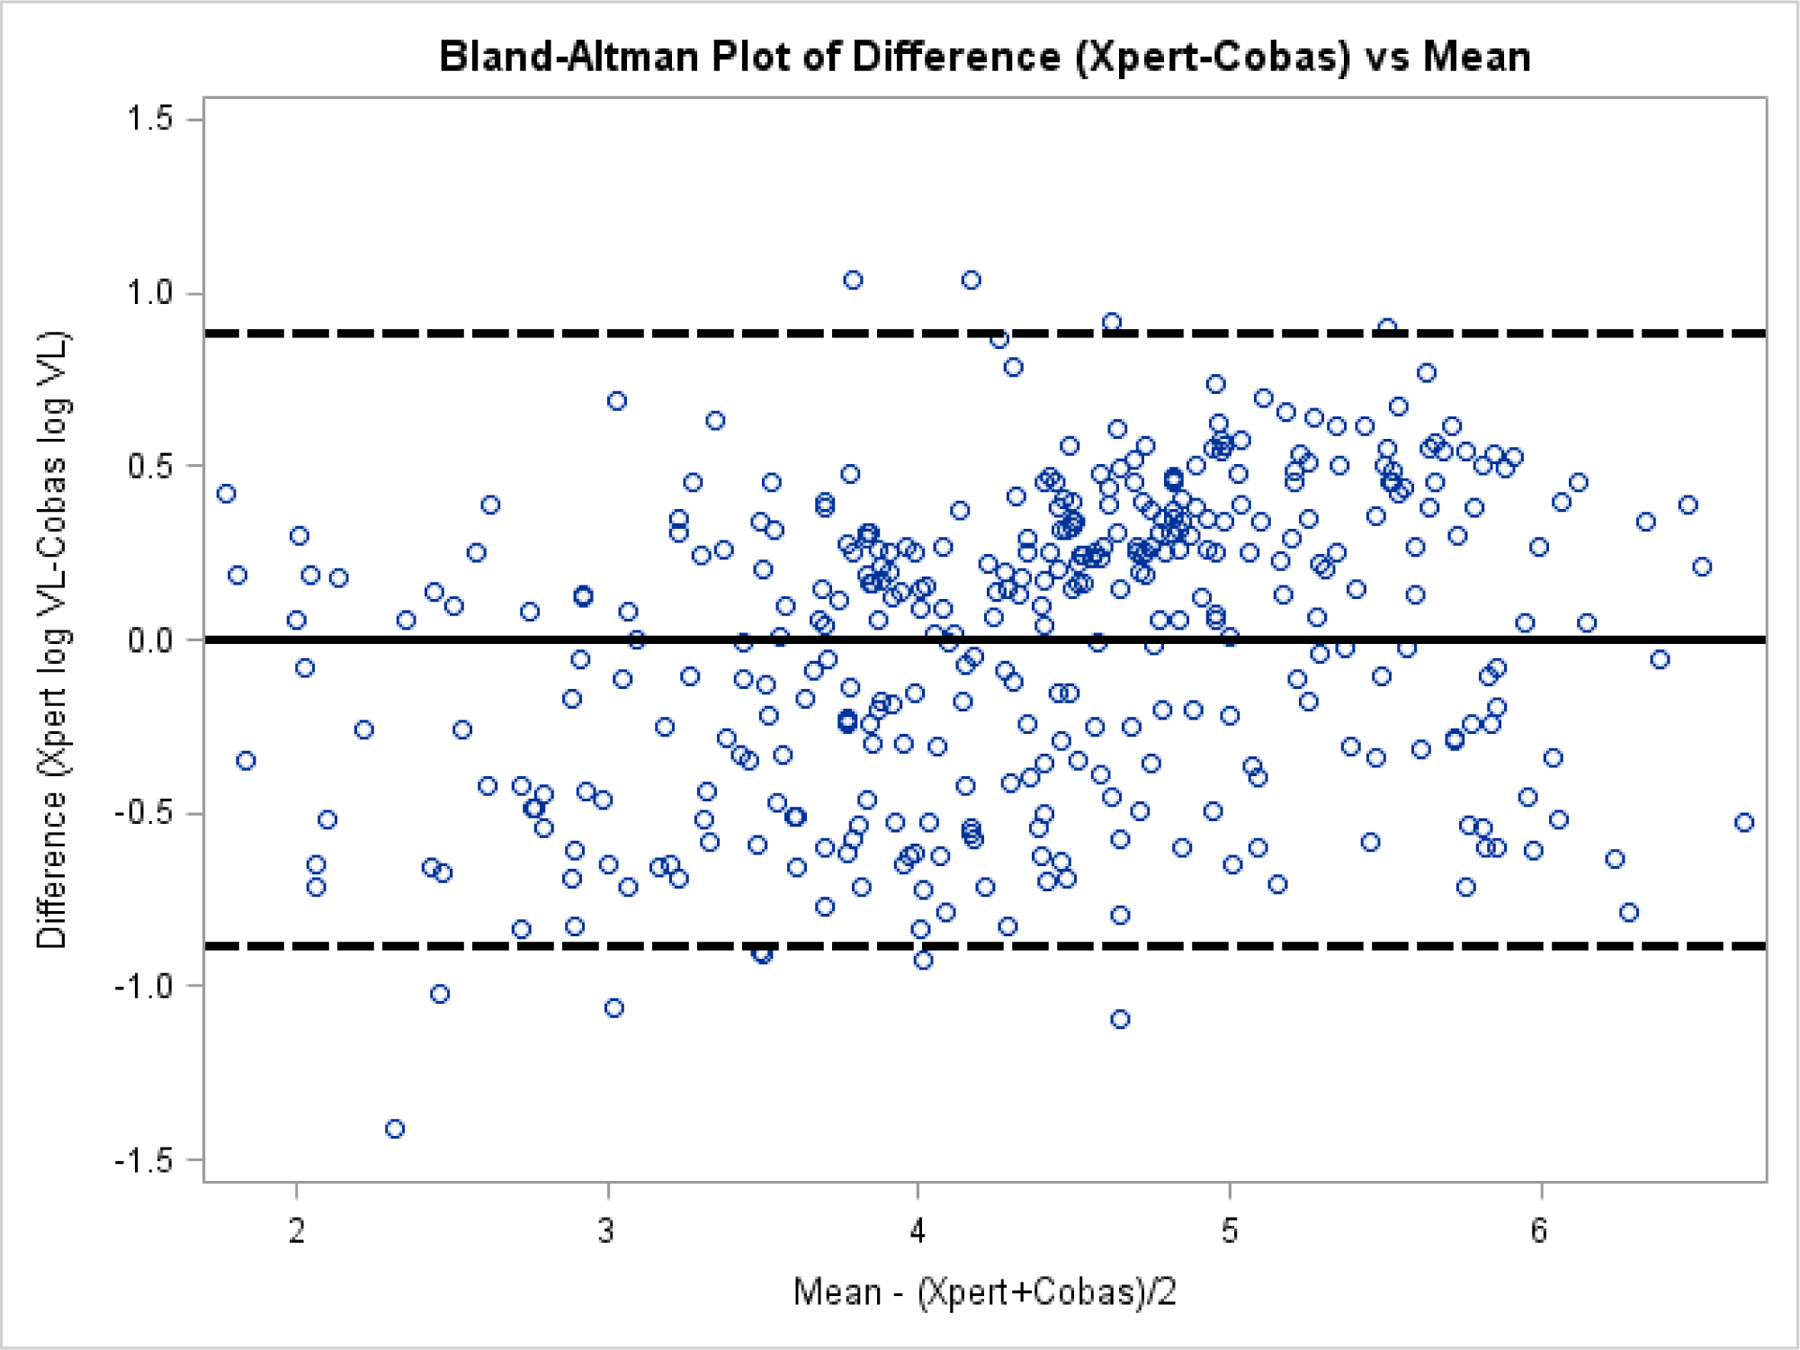
Figure 2.

Bland Altman plot of the difference of Cepheid Xpert log10 VL and the Cobas log10 VL against the mean log10 VL of specimens with quantifiable VLs from seroconverters, persons with established HIV-1 infections, and persons with HIV-1 non-B subtype and group O infections. The difference between Xpert and Cobas VLs was evenly distributed around zero at all mean concentrations of virus, and typically was within one log, though most were within half a log. The solid line is the mean of the difference. The hatched lines are at + and – 2 standard deviations of the mean of the difference.
