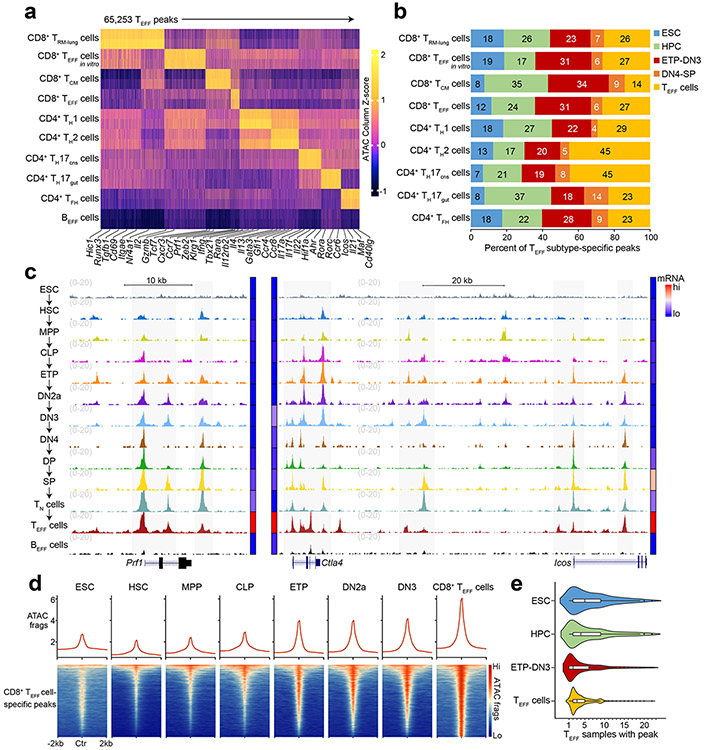
Figure 1. Chromatin accessibility at many T effector loci is established prior to TCR expression.
a, Heatmap of Z scores of TSS-normalized ATAC-seq fragments across the k-means clustered (k=9) T effector loci (hereafter TEFF loci) in lung CD8+IV−CD44+influenza-d35-specific tissue-resident memory CD8+ T cells20 (CD8+ TRM cells), CD8+CD19−γδTCR−TCRβhiCD44loCD62Lhi naïve T cells (TN cells) in vitro activated with CD3ε/CD28 Abs (CD8+ TEFF in vitro cells), CD8+KLRG1+CD127−LCMV-d7-specific terminal effector T cells17 (CD8+ TEFF cells), CD8+CD44+CD62L+LCMV-d180-specific central memory T cells17 (CD8+ TCM cells), IL-12/IL-4-Ab-treated CD4+ TN cells18 (TH1 cells), IL-4/IFNγ-Ab-treated CD4+ TN cells18 (TH2 cells), IL-17A-GFP+CD4+TCRβ+ T cells21 from ileum (TH17gut cells) or inflamed brain/spinal cord (TH17CNS cells), CD4+CXCR5+SLAMlo/int T cells19 (TFH cells) and IL-4/LPS-treated B cells (BEFF cells)22 (n=2 each). b, Bar plots showing the developmental stages at which TEFF loci specific to indicated TEFF cell subtypes in a first became accessible. Serum+LIF-maintained embryonic stem cells24 (ESCs), hematopoietic progenitor cells (HPCs) as aggregate of CD127−cKithiSca-1+Flt3− hematopoietic stem cells8 (HSCs), CD127−cKithiSca-1+Flt3+ multipotent progenitors8 (MPPs) and CD127+cKithiSca-1+Flt3+ common lymphoid progenitors8 (CLPs); ETP-DN3 thymocytes as aggregate of γδTCR−CD11b−CD11c−CD19−B220−NK-1.1−Gr-1−TER-119− (Lin−) cKithiCD25−CD4−CD8− (ETPs), and Lin−cKithiCD25hiCD4−CD8− (DN2a) and Lin−c-Kit−CD25hiCD4−CD8− (DN3); DN4-SP thymocytes as aggregate of Lin−c-Kit−CD25−CD44−CD4−CD8− (DN4), Lin−CD4+CD8+TCRβloCD69− (DP), Lin−CD4+CD8−TCRβhi (CD4SP) and Lin−CD4−CD8+TCRβhi (CD8SP) and indicated TEFF cells. c, Representative genome browser of ATAC-seq (1 of n=2 each) in ESC, HSC, MPP, CLP, ETP, DN2a, DN3, DN4, DP, CD8 SP, TN, TEFF, BEFF at Prf1 (TEFF=CD8+ TEFF in vitro), Ctla4 and Icos (TEFF=TFH). Adjoined bars indicate transcripts-per-million (TPM) from RNA-seq in each cell type of indicated gene. d, Representative aggregate histograms (top) and heatmaps (bottom) (1 of n=2) of ATAC-seq fragments of ESC, HSC, MPP, CLP, ETP, DN2a, DN3 and CD8+ TEFF in vitro that intersect open chromatin regions specific to CD8+ TEFF in vitro. e, Violin plots (boxes represent 1st, median and 3rd quartiles; whiskers represent median +/− 1.5 interquartile range) representing the number of overlap between each ATAC-seq peak (columns in a) and all T effector ATAC-seq profiles (rows in a), grouped by the developmental windows (ESC, HPC, ETP-DN3 and respective TEFF cells) during which the ATAC-seq peak first became accessible.

