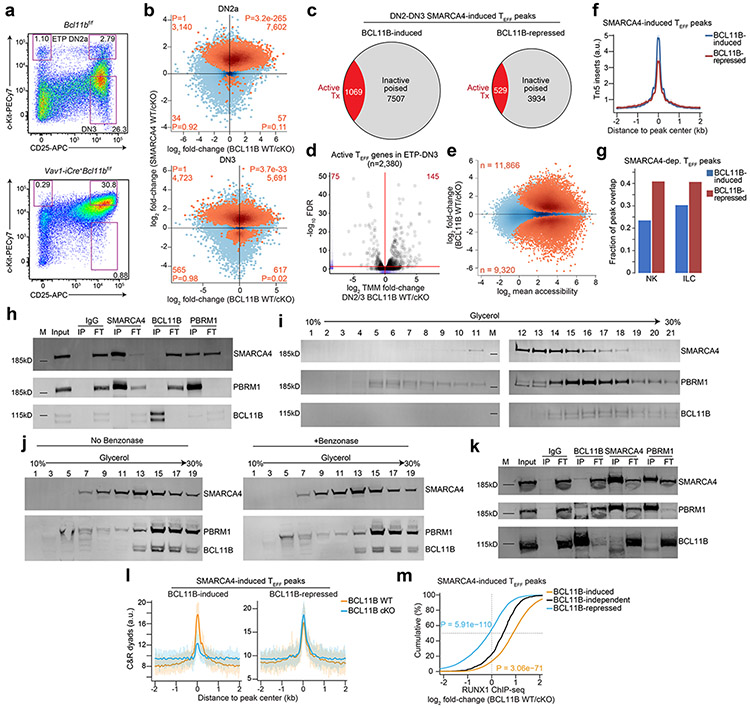
Extended Data Figure 8. SMARCA4 and BCL11B cooperate indirectly to promote chromatin accessibility at T effector loci in DN thymocytes.
a, Representative gating strategy for FACS of DN2-DN3 thymocytes from sex-matched littermates of Vav1-iCre+Bcl11bf/f or Bcl11bf/f mice. b, Top: Scatter plot depicting the log2 fold-change of normalized ATAC-seq fragments at TEFF loci between sorted BCL11B WT vs. BCL11B cKO primary DN2a thymocytes (n=2; horizontal axis) and in vitro differentiated SMARCA4 WT vs. SMARCA4 cKO DN2a thymocytes (n=3; vertical axis). SMARCA4-induced TEFF loci (Benjamini-Hochberg-corrected FDR < 0.1) peaks highlighted in orange. Number and statistical enrichment of SMARCA4-induced T effector loci (determined by one-sided Fisher’s exact test) within each Cartesian quadrant shown in orange. Bottom: Same as above between sorted BCL11B WT vs. BCL11B cKO DN3 primary thymocytes (n=2; horizontal axis) and in vitro differentiated SMARCA4 WT vs. SMARCA4 cKO DN3 thymocytes (n=2; vertical axis). c, Fraction of transcriptionally active jointly SMARCA4-induced BCL11B-induced TEFF loci in DN2-DN3 thymocytes (left; n=2) and of transcriptionally active jointly SMARCA4-induced BCL11B-repressed loci in DN2-DN3 thymocytes (right; n=2). d, Volcano plots of differential gene expression between sorted BCL11B WT vs. BCL11B cKO ETP-DN3 primary thymocytes (n=2) across actively transcribed T effector genes. Marginal rugs (blue lines) indicate distribution of values along each axis. e, MA plot depicting the log2 fold-change of normalized ATAC-seq fragments at TEFF loci between sorted BCL11B WT vs. BCL11B cKO DN2-DN3 primary thymocytes (n=2). Statistically significant differentially expressed peaks (Benjamini-Hochberg-corrected FDR < 0.1) are highlighted in orange. f, Representative aggregate histograms of ATAC-seq at jointly SMARCA4-induced BCL11B-induced vs. jointly SMARCA4-induced BCL11B-repressed TEFF loci in sorted BCL11B WT primary thymocytes (1 of n=2). g, Bar plots representing the fraction of jointly SMARCA4-induced BCL11B-induced vs. jointly SMARCA4-induced BCL11B-repressed TEFF loci in DN2-DN3 thymocytes that are also accessible in NK cells and ILCs (merged ILC1, ILC2, ILC3)11. h, Reciprocal co-immunoprecipitations of IgG, SMARCA4, BCL11B and PBRM1 (columns) from nuclear extracts (1mg/mL) of CCRF-CEM human T cell line and immunoblots of co-immunoprecipitating SMARCA4, PBRM1 and BCL11B (rows). (Input sample, immunoprecipitant (IP), flow-through fraction of non-interacting proteins (FT), molecular weight markers (M)). i, Density sedimentation (glycerol gradient; horizontal axis) and immunoblot of SMARCA4, PBRM1 and BCL11B (rows) from nuclear extracts of CCRF-CEM human T cell line. 1mg total extract loaded onto gradient. j, Density sedimentations (glycerol gradient; horizontal axes) and immunoblots of SMARCA4, PBRM1 and BCL11B (rows) from untreated nuclear extracts (left) and benzonase-treated nuclear extracts (right) of total thymocytes from WT mice. 1mg total extract loaded onto each gradient. k, Reciprocal co-immunoprecipitations of IgG, SMARCA4, BCL11B and PBRM1 (columns) from high-concentration nuclear extracts (10mg/mL) of total thymocytes from wild-type mice and immunoblots of co-immunoprecipitating SMARCA4, PBRM1 and BCL11B (rows). (Input sample, immunoprecipitant (IP), flow-through fraction of non-interacting proteins (FT), molecular weight markers (M)). l, Representative aggregate histograms of BAF155 occupancy (CUT&RUN) at jointly SMARCA4-induced, BCL11B-induced (left) vs. jointly SMARCA4-induced, BCL11B-repressed (right) T effector loci in sorted BCL11B WT vs. BCL11B cKO primary DN2-DN3 thymocytes (1 of n=2). m, Cumulative distribution functions of the log2 fold-change in RUNX1 occupancy (ChIP-seq32) between sorted BCL11B WT and BCL11B cKO primary DN2-DN3 thymocytes at BCL11B-induced, BCL11B-independent and BCL11B-repressed (n=2) TEFF loci. P-values from one-sided Wilcoxon signed-rank tests (using BCL11B-independent distribution as the null) are displayed.

