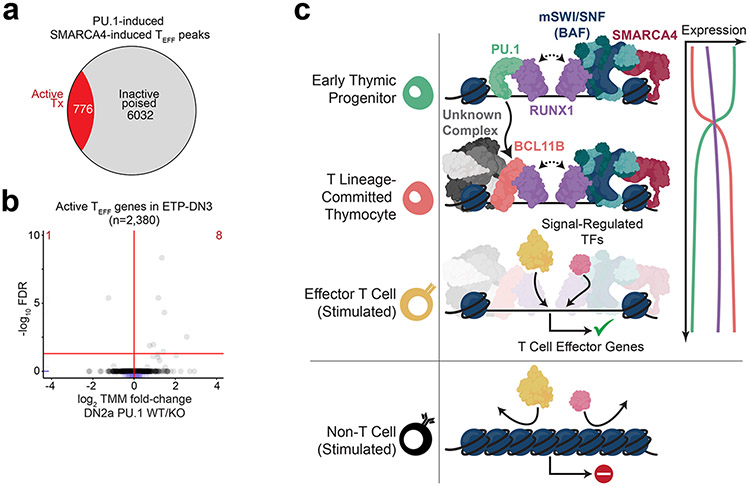
Extended Data Figure 10. Working model of transcription factor relay for specification of T effector potential.
a, Fraction of transcriptionally active jointly SMARCA4-induced, PU.1-induced loci in in vitro differentiated DN2a thymocytes (n=3). b, Volcano plot of differential gene expression between in vitro differentiated PU.1 WT vs. PU.1 cKO DN2a thymocytes (n=2) across actively transcribed T effector genes. Marginal rugs (blue lines) indicate distribution of values along each axis. c, Schematic of cooperative transcription factor relay that recruits and maintains mSWI/SNF occupancy at TEFF loci to equip thymocytes for T effector potential.

