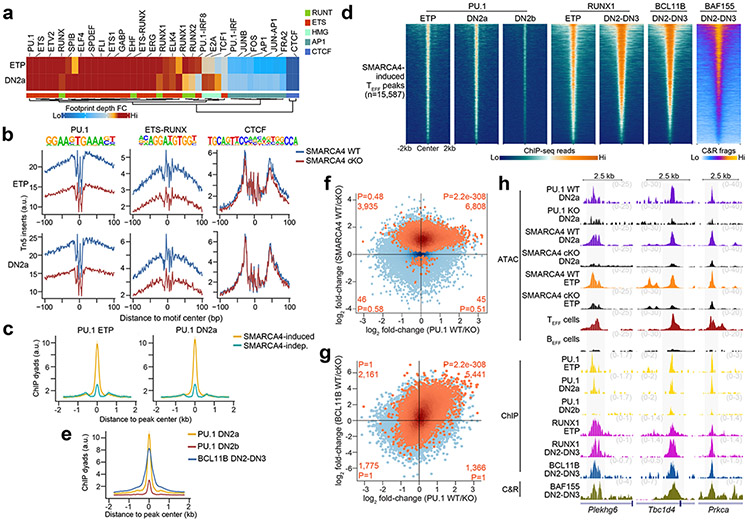
Figure 7. PU.1 partners with RUNX1 to poise TEFF loci at ETP-DN2a stages.
a, Heatmap representing the fold-change in transcription factor footprint depth (flanking accessibility height/footprint base) between in vitro differentiated SMARCA4 WT and SMARCA4 cKO ETP and DN2a thymocytes (n=3 each) for previously identified motifs within TEFF loci. b, Representative transcription factor footprints (i.e. ATAC-seq inserts near motifs) at TEFF loci centered on PU.1, ETS-RUNX and CTCF motifs in in vitro differentiated SMARCA4 WT vs. SMARCA4 cKO ETP (1 of n=3; top) and DN2a (1 of n=3; bottom) thymocytes. c, Representative aggregate histograms of PU.1 occupancy (ChIP-seq39) at SMARCA4-induced and SMARCA4-independent TEFF loci in ETPs (left) and DN2a (right) thymocytes (1 of n=2 for each). d, Representative heatmaps of PU.1 occupancy (ChIP-seq39) in ETP, DN2a and DN2b thymocytes (1 of n=2 each), RUNX1 occupancy (ChIP-seq27, 42) in ETP and DN2-DN3 thymocytes (1 of n = 2 each), BCL11B occupancy (ChIP-seq27) in DN2-DN3 thymocytes and BAF155 occupancy (CUT&RUN) in in vitro differentiated DN2-DN3 thymocytes (1 of n=3) at SMARCA4-induced TEFF loci. e, Representative aggregate histograms of PU.1 occupancy (ChIP-seq39) in DN2a and DN2b thymocytes and BCL11B occupancy (ChIP-seq27) in DN2-DN3 thymocytes at SMARCA4-induced TEFF loci. f, Scatter plot depicting the log2 fold-change of normalized ATAC-seq fragments at TEFF loci between in vitro differentiated PU.1 WT vs. PU.1 cKO DN2a thymocytes53 (n=3; horizontal axis) and in vitro differentiated SMARCA4 WT vs. SMARCA4 cKO DN2a thymocytes (n=3; vertical axis). SMARCA4-induced TEFF loci (Benjamini-Hochberg-corrected FDR < 0.1) peaks highlighted in orange. Number and statistical enrichment of SMARCA4-induced TEFF loci (determined by one-sided Fisher’s exact test) within each Cartesian quadrant shown in orange. g, Scatter plot depicting the log2 fold-change of normalized ATAC-seq fragments at TEFF loci between in vitro differentiated PU.1 WT vs. PU.1 cKO DN2a thymocytes53 (n=3; horizontal axis) and sorted BCL11B WT vs. BCL11B cKO primary DN2-DN3 thymocytes (n=2; vertical axis). h, Representative genome browser of ATAC-seq in in vitro differentiated PU.1 WT vs. PU.1 cKO DN2a thymocytes53 (1 of n=3), in vitro differentiated SMARCA4 WT vs. SMARCA4 cKO DN2a thymocytes (1 of n=3), in vitro differentiated SMARCA4 WT vs. SMARCA4 cKO ETPs (1 of n=3), TEFF cells (1 of n = 2) and BEFF cells (1 of n = 2), PU.1 occupancy (ChIP-seq39) in wild-type ETP, DN2a and DN2b thymocytes (1 of n=2 each), RUNX1 occupancy (ChIP-seq27, 42) in wild-type ETP and DN2-DN3 thymocytes (1 of n=2 each), BCL11B occupancy (ChIP-seq27) in wild-type DN2-DN3 thymocytes (1 of n=2) and BAF155 occupancy (CUT&RUN) in wild-type DN2-DN3 thymocytes (1 of n=3) at Plekhg6 (TEFF= CD8+ TEFF in vitro), Tbc1d4 (TEFF=TFH) and Prkca (TEFF=TH1) loci.

