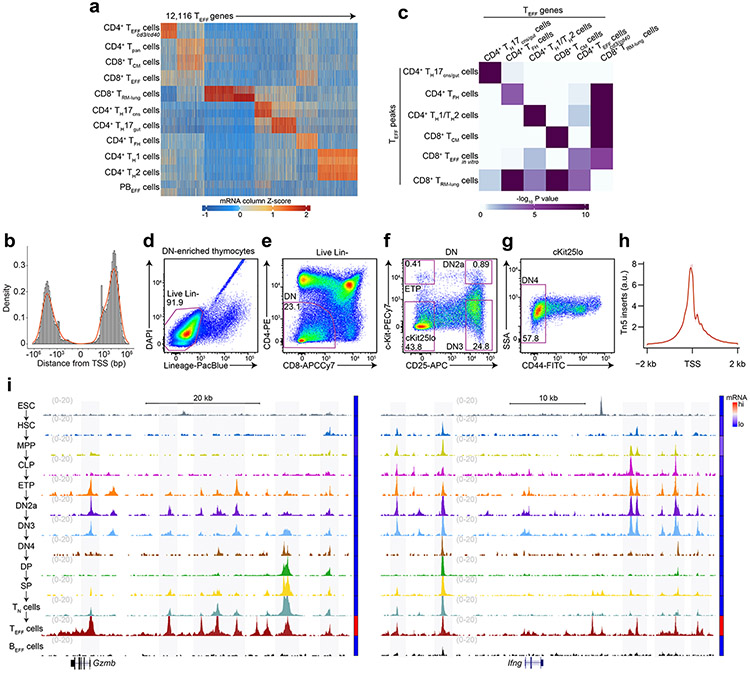
Extended Data Figure 1. T effector loci reflect the chromatin and transcriptional profiles of major T effector subtypes.
a, Heatmap of Z scores of TPM-normalized RNA-seq reads across the k-means clustered (k=7) transcriptomes (less genes robustly expressed in BEFF cells) of sorted CD4+CD44+TCRβlo splenic T cells21 18h post-injection with CD3/CD40 Abs (hereafter CD4+ TEFF cd3/cd40), splenic CD19−CD8−TCRβ+CD4+ T cells21 (hereafter CD4+ Tpan), TCM, CD8+ TEFF, TRM, TH17CNS, TH17gut, TFH, TH1, TH2 and CD11b−NK-1.1−TCRβ−CD138+Blimp1intMHCIIhi plasmablast cells21 (hereafter PBEFF) (n=2 each). b, Distribution of genomic displacement of T effector loci (hereafter TEFF loci) in relation to the nearest TSS (signed logarithmic scale). c, Heatmap of statistical enrichment (one-sided Fisher’s exact test) of TEFF peaks whose nearest gene is in RNA-seq k-means cluster i (horizontal axis) within an ATAC-seq k-means cluster j (vertical axis; see Fig. 1a). d-g, Representative flow cytometry plots illustrating gating strategy for in vivo DN thymocyte FACS. h, Representative distribution (for all ATAC-seq samples) of normalized Tn5 insertions within 2 kb of transcriptional start-sites (TSS). i, Representative genome browser of ATAC-seq in ESC29, HSC11, MPP11, CLP11, ETP, DN2a, DN3, DN4, DP, CD8 SP, TN, TEFF cells and BEFF cells at Gzmb (TEFF=CD8+ TEFF in vitro) and Ifng (TEFF=TH1) loci (1 of n=2 for each). Adjoined bars indicate RNA-seq-determined transcripts-per-million (TPM) in each cell type.

