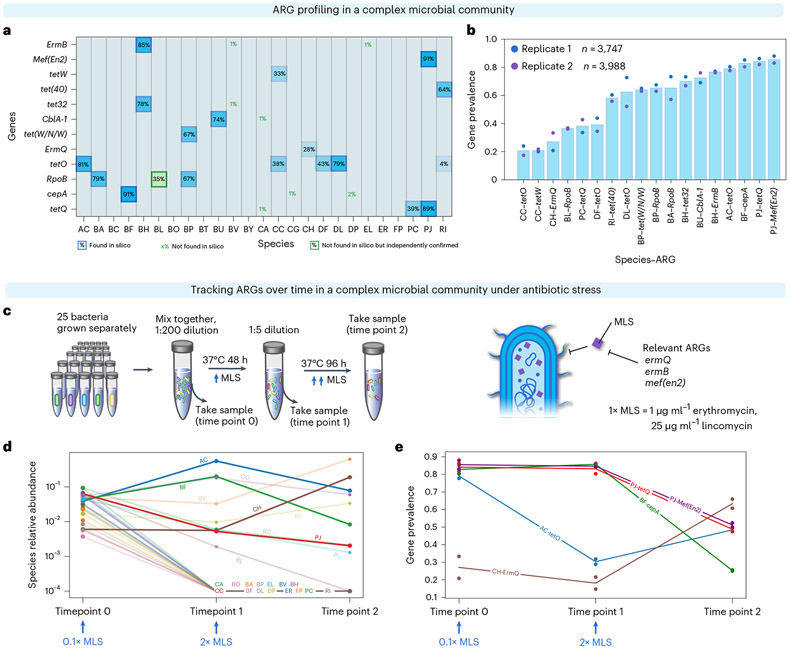
Fig. 2 ∣. DoTA-seq enables tracking of gene-species dynamics in a complex human gut microbial community.
a, Heat map of ARG–species associations in a 25-member synthetic gut microbial community for a representative replicate. For each species (x axis) and ARG (y axis), the proportion of cells containing the gene (gene prevalence) is shown. The opacity of the background for each box is proportional to the prevalence value. Computationally predicted ARGs based on genome sequence are outlined in blue. ARGs that were not found in the species’ genome sequence but observed using DoTA-seq as well as independently confirmed are outlined in green boxes. ARGs that were not found in a given species’ genome sequence are represented by green text. Species include BA, Bifidobacterium adolescentis; ER, Eubacterium rectale; FP, Faecalibacterium prausnitzii; AC, Anaerostipes caccae; CC, Coprococcus comes; RI, Roseburia intestinalis; DP, Desulfovibrio piger; BH, Blautia hydrogenotrophica; CA, Collinsella aerofaciens; PC, Prevotella copri; DL, Dorea longicatena; CG, Clostridium asparagiforme; BF, Bacteroides fragilis; EL, Eggerthella lenta; CH, Clostridium hiranonis; BO, Bacteroides ovatus; BT, Bacteroides thetaiotaomicron; BU, Bacteroides uniformis; BV, Bacteroides vulgatus; BC, Bacteroides caccae; BY, Bacteroides cellulosilyticus; PJ, Parabacteroides johnsonii; DF Dorea formicigenerans; BL, Bifidobacterium longum subsp. infantis; BP, Bifidobacterium pseudocatenulatum (Supplementary Table 1). b, Bar plot of the average gene prevalence for ARGs for each ARG–species combination that displayed greater than or equal to 10% prevalence. Data points represent values from technical replicates (n = 2). c, Schematic of the experiment for tracking changes in ARGs in response to antibiotics. MLS, erythromycin and lincomycin. d, Relative abundance of species at each measurement time determined by DoTA-seq. The lines corresponding to species that were not detected after passage 1 or did not contain ARGs are semi-transparent. Data points represent values of technical replicates (n = 2). e, Prevalence of ARG–species associations at different passages. Species that were not detected after passage 1 and/or did not contain targeted ARGs are excluded from this graph. Lines correspond to the mean and data points represent technical replicates (n = 2).

