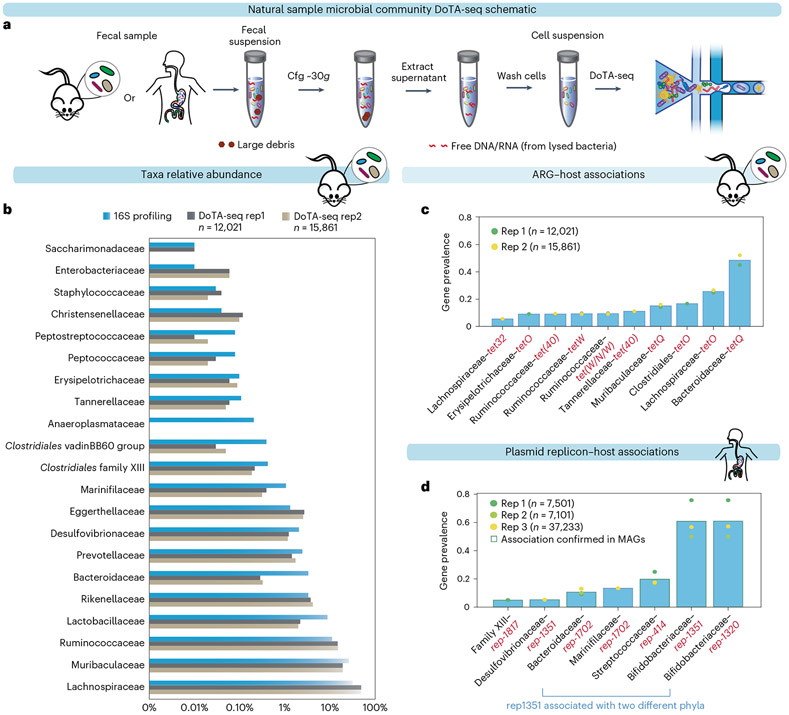
Fig. 3 ∣. DoTA-seq elucidates ARG and plasmid–taxa associations in fecal microbial communities.
a, Schematic of cell extraction procedures for DoTA-seq of natural samples. b, Comparison between 16S rRNA gene profiling and DoTA-seq relative abundance of the major taxa (>0.01% relative abundance) in the mouse fecal community. c, Bar plot of the gene prevalence of ARGs in the mouse fecal sample. The bar represents the average of two technical replicates. d, Bar plot of the gene prevalence of plasmid replicons in the human fecal sample. The bar represents the average of two technical replicates plus one additional technical replicate that sequenced ~37,000 cells. The circular markers represent individual replicates. The red outlines represent replicon–host associations that are also found in a database of human gut MAGs.

