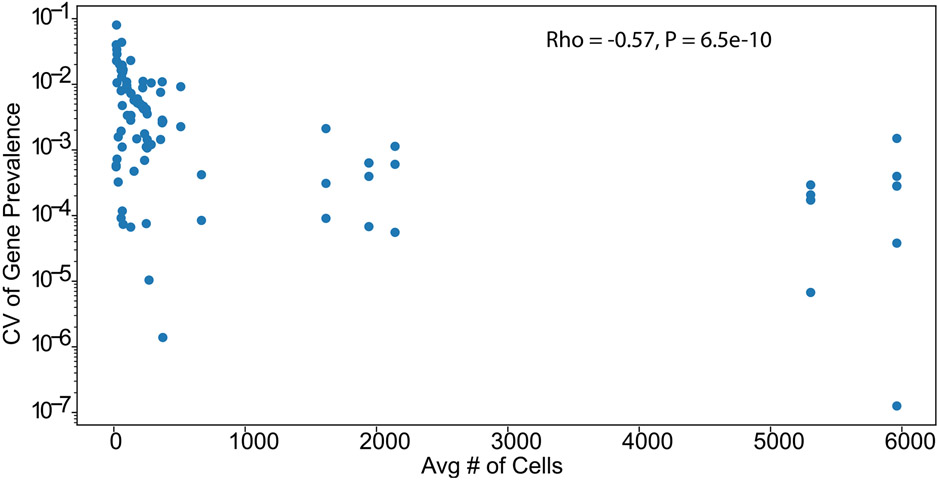
Extended Data Fig. 2 ∣. Coefficient of variation for technical replicates is negatively correlated with number of cells sequenced.
Scatter plot of the average number of cells for that species versus the coefficient of variation (CV) of gene prevalence for two technical replicates for every gene-species pair. CV is calculated as the standard deviation divided by the mean. The negative Spearman correlation (Rho) suggests that a moderate fraction of the variance found between technical replicates can be attributed to stochasticity due to small numbers of cells. P-value is based off comparison to a two-sided t-test null distribution.

