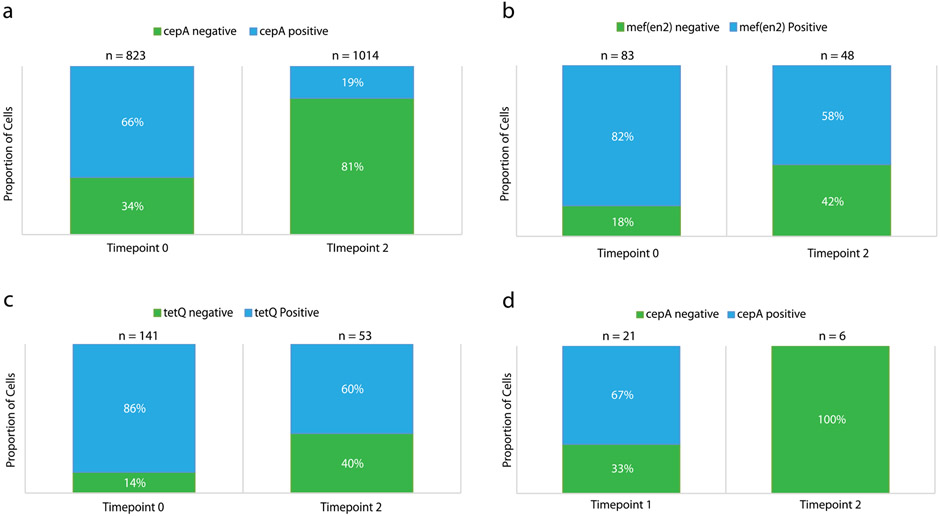
Extended Data Fig. 5 ∣. Independent confirmation of DoTA-seq results in Fig. 2 by colony and single-cell PCR genotyping.
Droplet PCR genotyping for (a) B. fragilis (BF) and the cepA gene, (b) P.johnsonii (PJ) and the mef(en2) gene, or (c) PJ and the tetQ gene. Cells were fixed and subjected to digital PCR amplification for species marker genes and ARGs in an emulsion PCR (see Methods). Blue bars show the proportion of droplets that showed amplification for the species marker gene as well as the ARG, green bars show the proportion of droplets that show amplification for the species marker gene (rpoB) but not the ARG. Time 0 and time 2 represents timepoints 0 and 2 from the synthetic community antibiotic experiment, respectively. n represents the number of species marker gene positive droplets that were counted in total for each condition. (d) Colony PCR genotyping of B. fragilis (BF) colonies of cells originating from the synthetic human gut community experiment exposed to antibiotics. Colonies from glycerol stocks of samples taken at timepoints 1 and 2 of the synthetic community antibiotics experiment shown in Fig. 3 are genotyped by qPCR for the BF specific rpoB gene and the antibiotic resistance gene cepA. The proportion of cepA positive colonies are shown in red, and proportion of cepA negative colonies are shown in blue. n represents the number of colonies that were positively identified as BF by successful amplification of the BF specific rpoB gene. In total, 24 colonies from timepoint 1 and 32 colonies from timepoint 2 were genotyped (many colonies were not BF). Data are result of one independent experiment.

