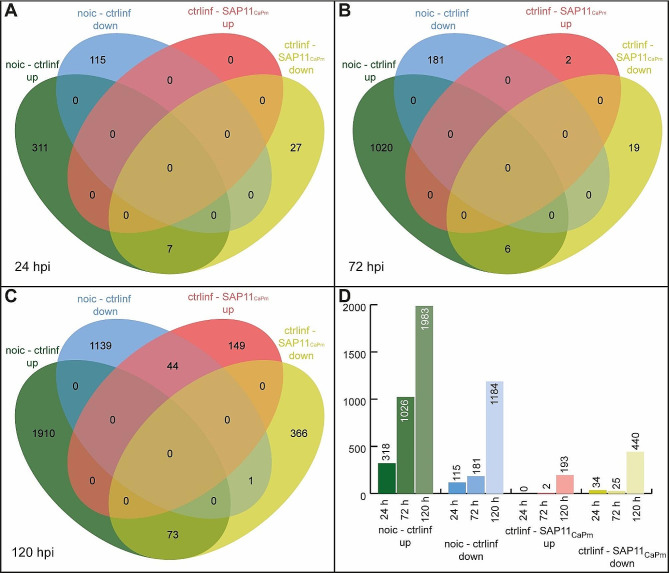
Fig. 4.
Numbers of DETs at log2fold change (L2FC) of ≥ ± 2; 4-fold differential expression, p-value cutoff for FDR < 0.001. The VENN diagram shows DETs detected at (A) 24, (B) 72 and (C) 120 h after infiltration. Up- and downregulated transcripts in control-infiltrated samples and SAP11CaPm infiltrated samples were analyzed using jvenn [37]. (D) The barplot summarizes for each time point the total number of up- (green) and downregulated (blue) transcripts upon control- infiltration in comparison to non -infiltration and up- (red) or downregulated (yellow) transcripts due to infiltration with SAP11CaPm in comparison to control-infiltration

