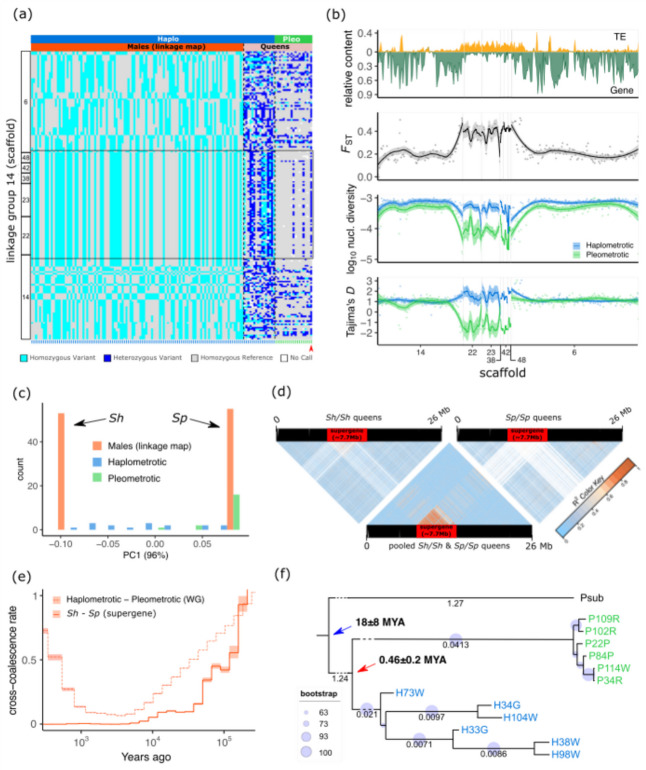
Fig. 3.
Genomic architecture and recombination rates at the linkage group (LG) 14 harboring a putative supergene. a Genotypes for 108 sons from a single monogynous queen (haplometrotic population) based on ddRAD markers and for the 35 queen samples from the pleometrotic and haplometrotic populations based on sites corresponding to ddRAD markers from the whole-genome resequencing data. Each row shows a SNP marker (182 in total) distributed across seven scaffolds on LG14. Columns (green ticks at the bottom for pleometrotic and blue ticks for haplometrotic) represent individual samples grouped by population (pleometrotic and haplometrotic) and dataset (males and queens). The black rectangle highlights the non-recombining putative supergene region, spanning scaffolds 22, 23, 38, 42, and 48 and parts of scaffolds 6 and 14. Red arrowhead indicates the hybrid pleometrotic queen (P99P). b Sliding window analyses of LG14, showing (from top to bottom) the relative TE and gene content, genetic differentiation (FST) between populations, nucleotide diversity (π), and Tajima’s D estimates in the pleometrotic (green) and haplometrotic (blue) populations. c Principal component analysis (PC1; 96%) based on 69 markers spanning the supergene region showing that the 108 male haplotypes are either Sh (negative PC1 scores) or Sp (positive PC1 scores). Diploid queens on the other hand are either homozygous for the Sp allele (most of pleometrotic queens, green bars) or heterozygous Sh/Sp (most of the haplometrotic queens, blue bars). d Linkage disequilibrium (LD) estimates (r2) across LG 14 for Sh homozygous queens (n = 6), pooled queens homozygous for Sh (n = 6) and Sp (n = 6), and Sp homozygous queens only (n = 6). The red rectangle shows the region of no recombination between the Sh and Sp haplotypes. SNPs are ordered according to physical position on the chromosome after lift over. Note that invariant marker sites are displayed in white, dominating particularly the homozygous Sh/Sh and Sp/Sp LD plots. e Demographic history of the supergene computed using MSMC2 with queens homozygous for the Sh (n = 4) and Sp (n = 4) alleles. The solid line shows the relative cross-coalescence rate (rCCR) at the supergene, while the dash-dotted line gives the genome-wide rCCR estimates. Lines and shaded areas are means and 95% confidence intervals, respectively. f Maximum-likelihood tree for the supergene region using 33,424 SNPs and P. subnitidus as outgroup species. Small branch length values at the tips of the tree were omitted for ease of visualization (Newick tree can be found in Additional file 7). The blue arrow indicates the upper bond estimate for the speciation of P. subnitidus and P. californicus 18 (95% highest probability density (HPD) ± 8) million years ago (MYA). The red arrow indicates the age estimate for the formation of the Sh–Sp haplotype groups 0.46 (95% HPD ± 0.2) MYA

