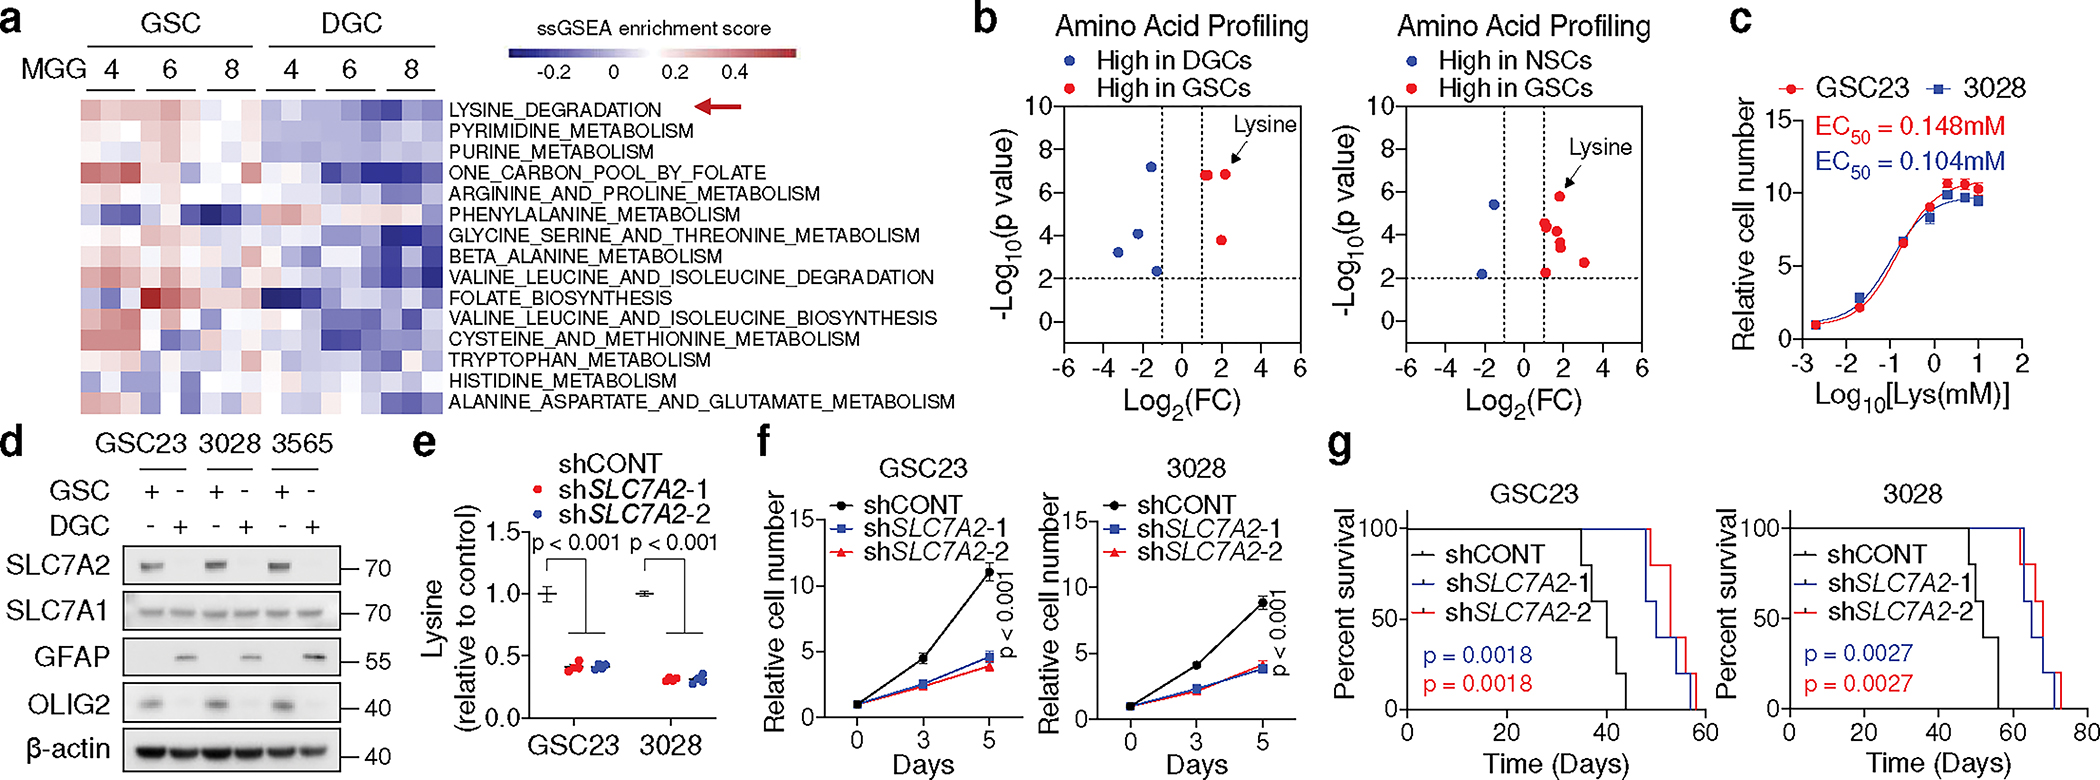
Fig. 1. GSCs upregulate lysine catabolism through SLC7A2.

a, ssGSEA of metabolic gene sets from KEGG database in three GSCs (MGG4, MGG6, MGG8) and matched DGCs. Each cell contains 3 replicates from GSE54791.
b, Volcano plots summarizing intracellular amino acid levels across GSCs, DGCs, and NSCs from 5 biological replicates. Fold changes in amino acid levels relative to the average of GSCs are displayed.
c, Relative cell number of two GSCs cultured in media with different doses (0.002, 0.02, 0.2, 0.8, 2, 5, 10 mM) of L-lysine for 5 days.
d, IB analysis of matched GSCs and DGCs.
e, f, Relative intracellular lysine levels (n = 4 biologically independent samples, e) and cell proliferation (f) of GSCs with or without SLC7A2 KD.
g, Kaplan-Meier plots showing survival of immunocompromised mice bearing intracranial tumours from GSCs with or without SLC7A2 KD (n = 5).
Data are presented from three independent experiments in c and f. Representative of two independent experiments in d. In c, e and f, data are presented as mean ± SEM. Two-tailed unpaired t test for b, one-way ANOVA followed by multiple comparisons with adjusted p values for e, two-way ANOVA followed by multiple comparisons with adjusted p values for f, log-rank test for g.
